#COVID19 cases in the US reported by @CDCGov have continued their week-after-week exponential decline that began in mid-April. This is exceptionally welcome news, although I'm now watching closely for variants driving sub-epidemics despite overall cases falling. 1/10
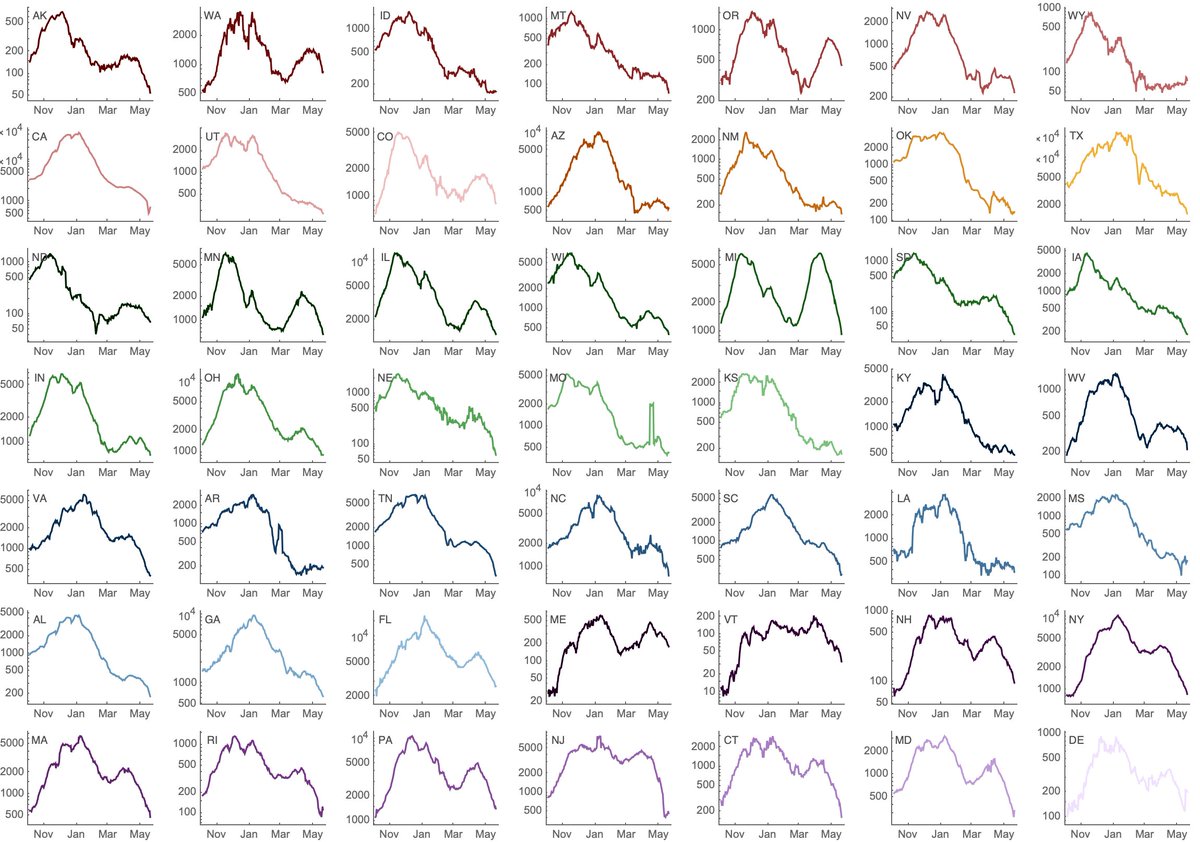
If we look at state-level cases with a log-axis we can see exponential growth and then exponential decline visible as straight lines on the log plot. Some states have had recent precipitous declines (NY, MA, MI), while others have been more stable (WA, CO, OR). 2/10
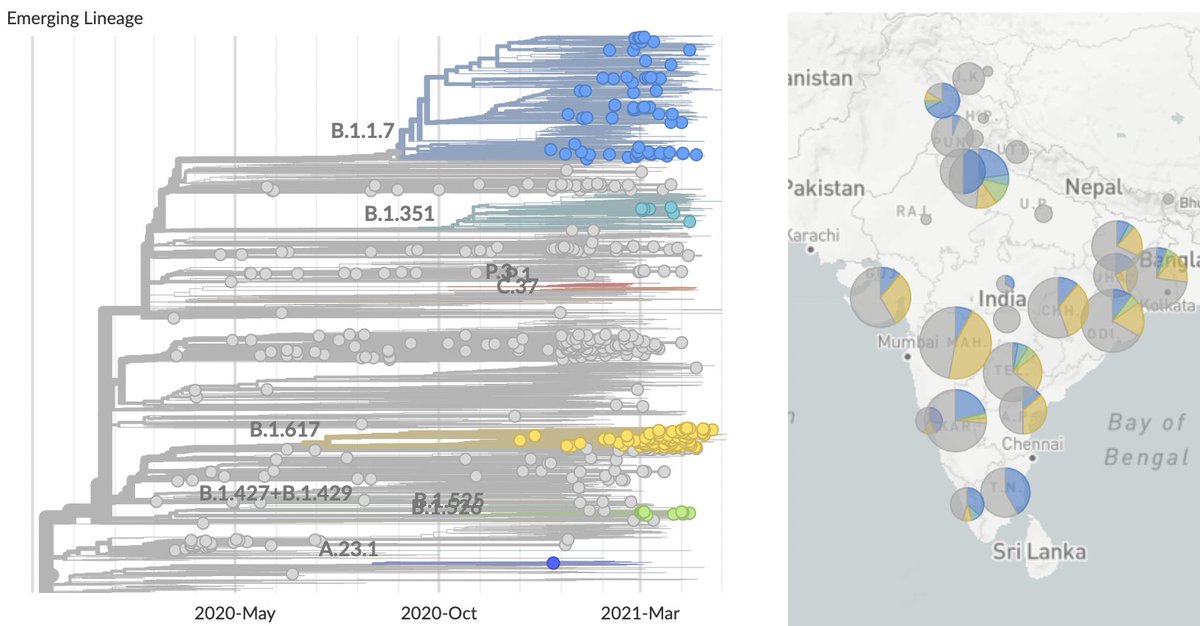
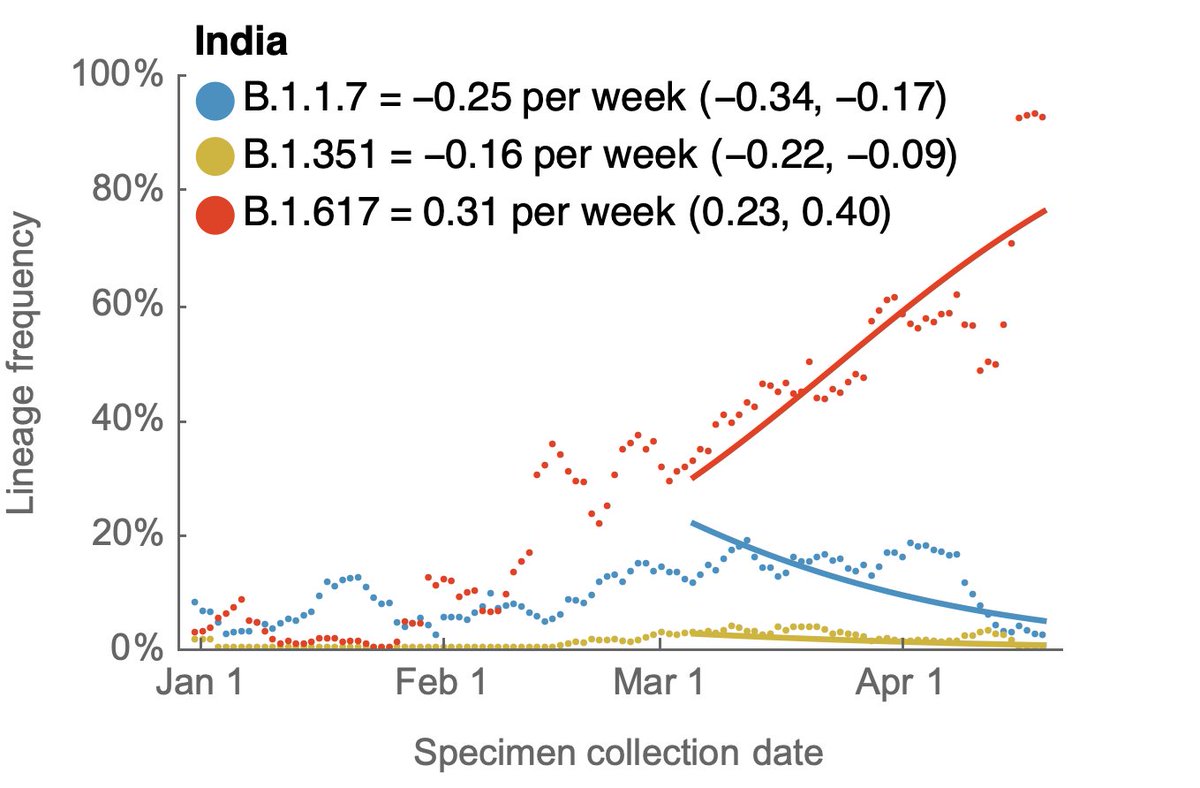
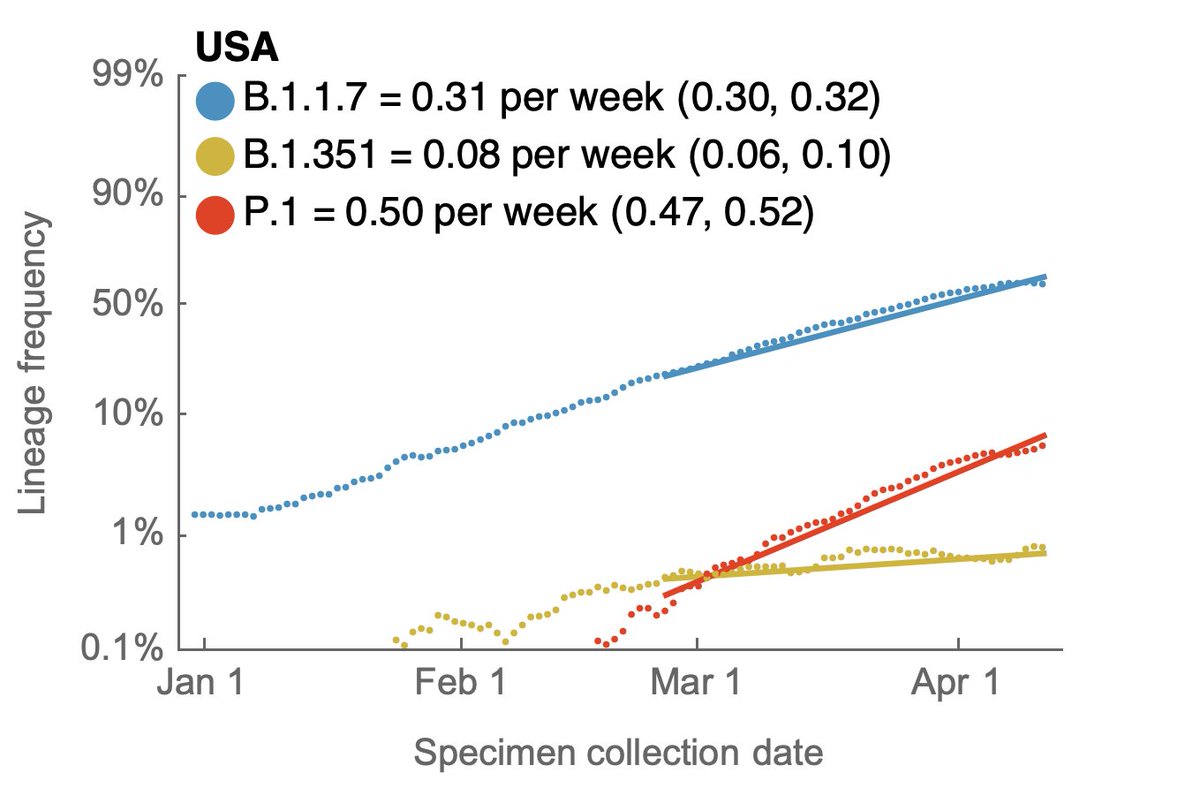
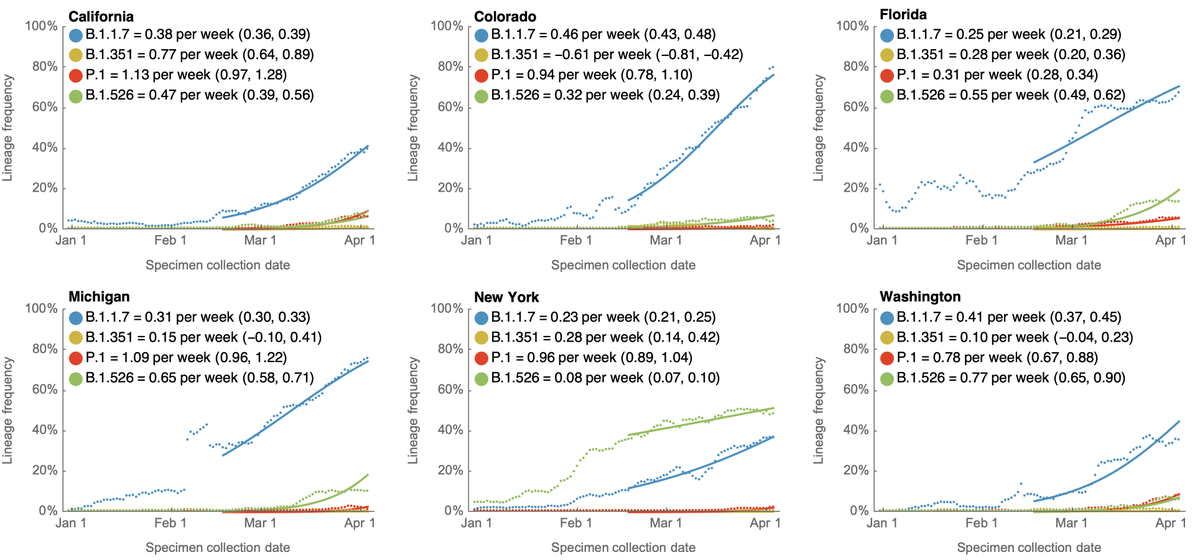
Using genomic data shared to @GISAID, we can plot frequency of different variant lineages through time and across states to get a sense of competitive dynamics. Here, I'm plotting lineage frequency on a logit axis, so that logistic growth is visible as a straight-line fit. 3/10
Relative fitness becomes more clear as variants are placed in direct competition. B.1.1.7 and B.1.526 had been increasing rapidly in frequency in New York. However, since they reached high frequency they've been in more direct competition and B.1.1.7 has edged out B.1.526. 4/10
I'm now watching Illinois in particular where P.1 is at ~30% frequency and B.1.1.7 is at ~60% frequency to see if P.1 starts to displace B.1.1.7 there. 5/10
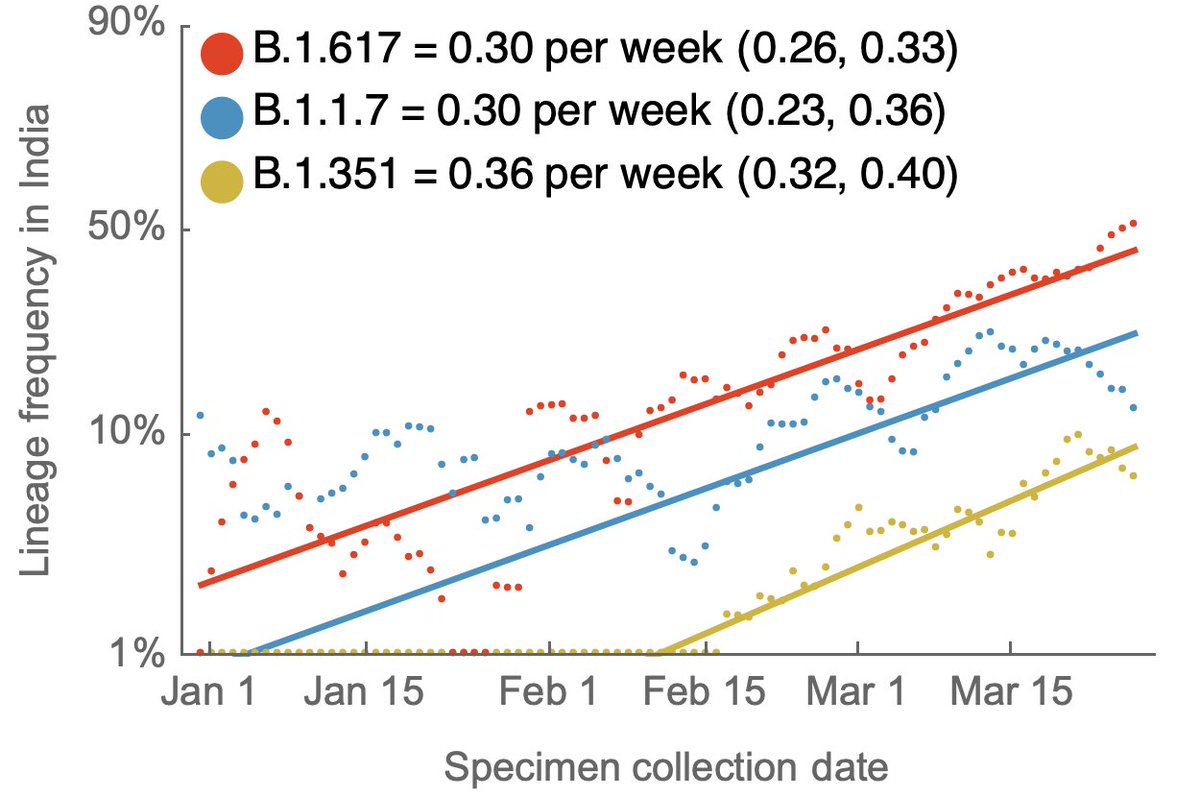
Looking across these nine states, the current ranking of logistic growth rate seems to be B.1.617 > P.1 > B.1.1.7 > B.1.526 > B.1.351. 6/10
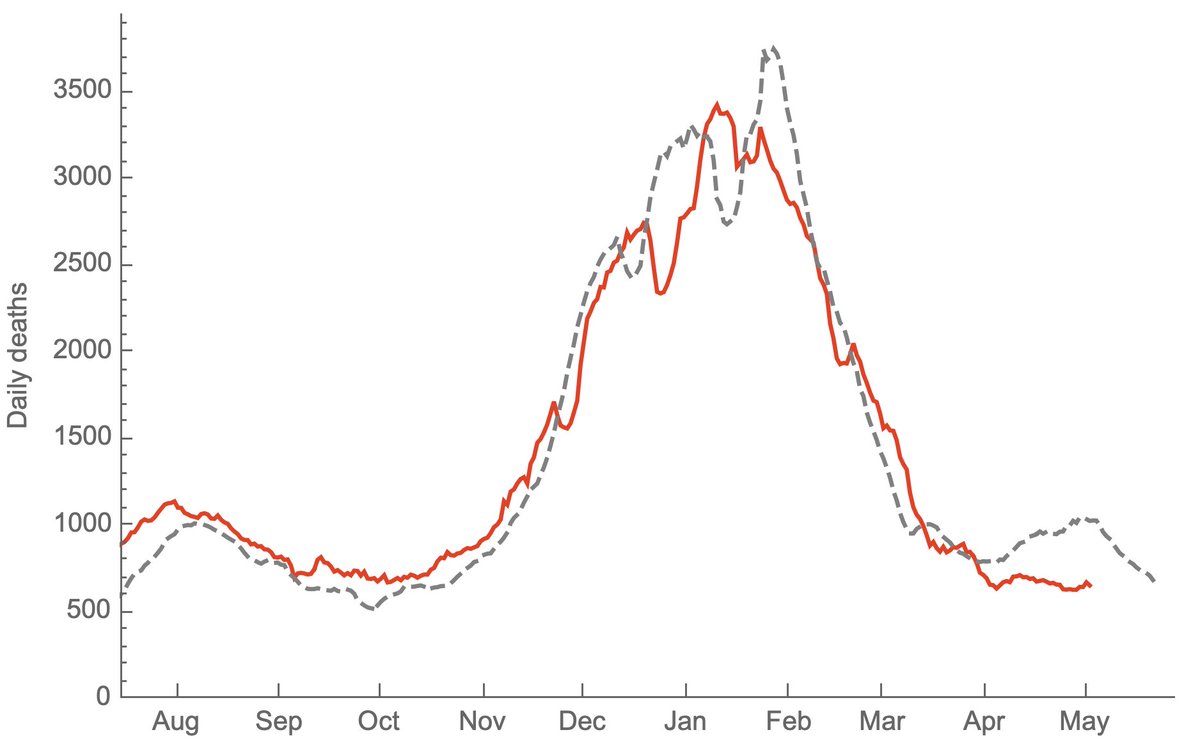
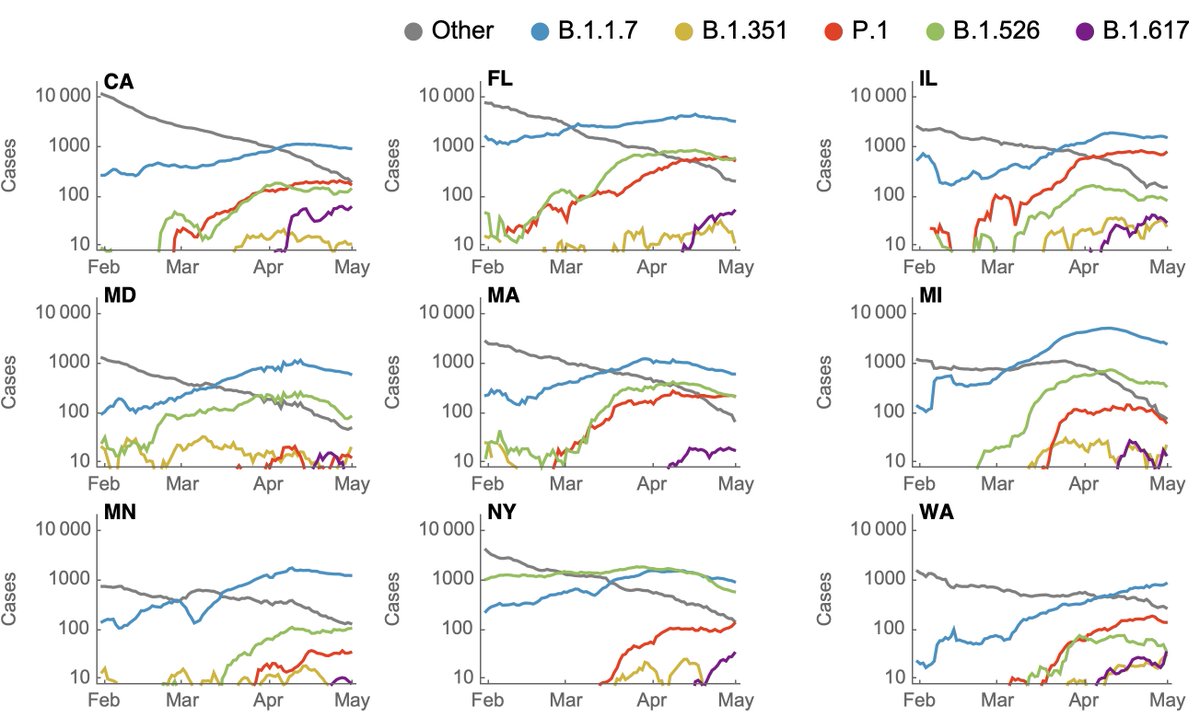
Although frequencies are useful to assess competitiveness of different variants, we're interested in case counts to assess whether a variant may be driving an epidemic. Here, I'm using genomic data to partition case counts as described previously. 7/10
Doing so with this latest data gives the following picture where it's clear that non-variant viruses have been declining throughout the spring, while variant viruses have been responsible for multiple state-level epidemics (B.1.526 in NY, B.1.1.7 in MI, MD and MN). 8/10
Because the genomic data is necessarily lagged, this is looking back to the beginning of May and the last 3 weeks of declines in cases are not included. However, even here, there are some encouraging trends of absolute growth of P.1 starting to level off. 9/10
B.1.617 is, of course, worrisome and may gain ground quickly on other lineages, although its lack of significant immune escape makes me less worried about large-scale spread in the US. However, there is still a large unvaccinated population in which B.1.617 may drive cases. 10/10

• • •

Missing some Tweet in this thread? You can try to force a refresh
 

Keep Current with Trevor Bedford

Trevor Bedford Profile picture

Stay in touch and get notified when new unrolls are available from this author!

Read all threads

This Thread may be Removed Anytime!

PDF

Twitter may remove this content at anytime! Save it as PDF for later use!

Try unrolling a thread yourself!

how to unroll video
  1. Follow @ThreadReaderApp to mention us!

  2. From a Twitter thread mention us with a keyword "unroll"
@threadreaderapp unroll

Practice here first or read more on our help page!

More from @trvrb

11 May
The drivers of the #COVID19 epidemic in India are certainly multifactorial, but we have now seen the viral lineage B.1.617 linked to this epidemic continue to increase in frequency in India and spread rapidly outside of the country. 1/10
Looking within India there are three primary viral lineages of consequence: B.1.1.7 (in blue) and B.1.351 (in green) introduced into India repeatedly from outside the country and B.1.617 (in yellow) emerging endogenously from within India (nextstrain.org/ncov/asia?c=em…). 2/10
Tracking frequencies over time in sequence data shared to @gisaid shows a continued increase in B.1.617, while recent weeks have shown a decline in B.1.1.7. 3/10
Read 10 tweets
7 May
From Aug 2020 to Mar 2021, the lagged case fatality rate (CFR) of the US #COVID19 epidemic had remained largely constant at ~1.5% and provided a simple method to predict subsequent deaths from current cases. 1/6
I've rerun the previous analysis correlating state-level reported cases with state-level reported deaths with different lags. Using @CDCgov data since Aug 2020, I find that a 19 day lag of cases to deaths maximizes average state-level correlation coefficient. 2/6
This shows the resulting projection for deaths where the gray dashed line shows a lookahead projection where 1.5% of reported cases result in reported deaths 19 days later. This can be compared to the solid red line showing realized 7-day average of reported deaths. 3/6
Read 6 tweets
3 May
Just as we can decompose the US #COVID19 epidemic into a B.1.1.7 epidemic and a non-B.1.1.7 epidemic, we can further partition by variants of concern B.1.1.7, B.1.351 and P.1, where it's clear that P.1 has been gaining ground. 1/13
Here, using data from @GISAID, we see that in terms of frequencies across the US, P.1 has been undergoing more rapid logistic growth in frequency than B.1.1.7, while B.1.351 has been slower than B.1.1.7. 2/13
I'm plotting this with the unusual "logit" y-axis (with 1%, 10%, 50%, etc...) because a straight line in logit space is indicative of logistic growth. This sort of plot makes it easy to compare logistic growth rate of frequency between lineages with different frequencies. 3/13
Read 13 tweets
26 Apr
There are effectively two #COVID19 epidemics in the US at this moment; one largely resolving epidemic comprised of non-variant viruses and one growing epidemic of B.1.1.7. Together they have resulted in a near-plateau of cases throughout much of the spring. 1/10
If we look at virus frequencies in the US using data in @GISAID, we can see that the 7-day weighted frequency of B.1.1.7 has been growing consistently since January and is now over 50% in the US. 2/10
This pattern is repeated across individual states. These six were chosen as states with plentiful genomic data and to provide geographic diversity. B.1.1.7 is dominating throughout the US, except for New York and surroundings where B.1.526 is co-circulating. 3/10
Read 10 tweets
23 Apr
It's hard for me to infer the degree to which new variants are driving the surge in cases in India, but we are seeing rapid growth in frequency of multiple viral variants. 1/5
Here is a @nextstrain view of @GISAID data that focuses on viruses from India and highlights emerging lineages B.1.1.7 (in blue), B.1.351 (in green) and B.1.617 (in orange). Interactive version at nextstrain.org/ncov/asia?c=em…. 2/5
We can fit a logistic growth model to the full genomic dataset from India for these three lineages, where we see logistic growth as "linear on a logit scale". Each of these lineages is estimated to have similar logistic growth rates of ~0.3 per week. 3/5
Read 5 tweets
23 Apr
When variants of concern were first identified in late Dec, the US was not where it needed to be in terms of genomic surveillance. However, with considerable ramp up by the CDC, state labs and academic groups, we now have a remarkable genomic surveillance system. 1/14
My favorite metric for genomic surveillance is the number of cases that have been sampled, sequenced and shared publicly to @GISAID in the previous 30 days. By incorporating both sequencing volume and turnaround time, it tells you how much is known about current circulation. 2/14
Throughout the fall, the US had just 100-300 genomes available that were sampled, sequenced and shared in the previous 30 days. 3/14
Read 14 tweets

Did Thread Reader help you today?

Support us! We are indie developers!


This site is made by just two indie developers on a laptop doing marketing, support and development! Read more about the story.

Become a Premium Member ($3/month or $30/year) and get exclusive features!

Become Premium

Too expensive? Make a small donation by buying us coffee ($5) or help with server cost ($10)

Donate via Paypal Become our Patreon

Thank you for your support!

Follow Us on Twitter!

:(