Hold2 Profile picture
26 Jun, 4 tweets, 2 min read
US CoV2 Update: 6/26/21

Cases w/inflection points labeled. Summer stimulus with upward pressure has arrived.

As expected, amplitude is minimal.

Spring Peak:
- 2020: 4/13
- 2021: 4/12

June Trough:
- 2020: 6/10
- 2021: 6/18

Summer Peak:
- 2020: 7/23
- 2021: TBD

/1
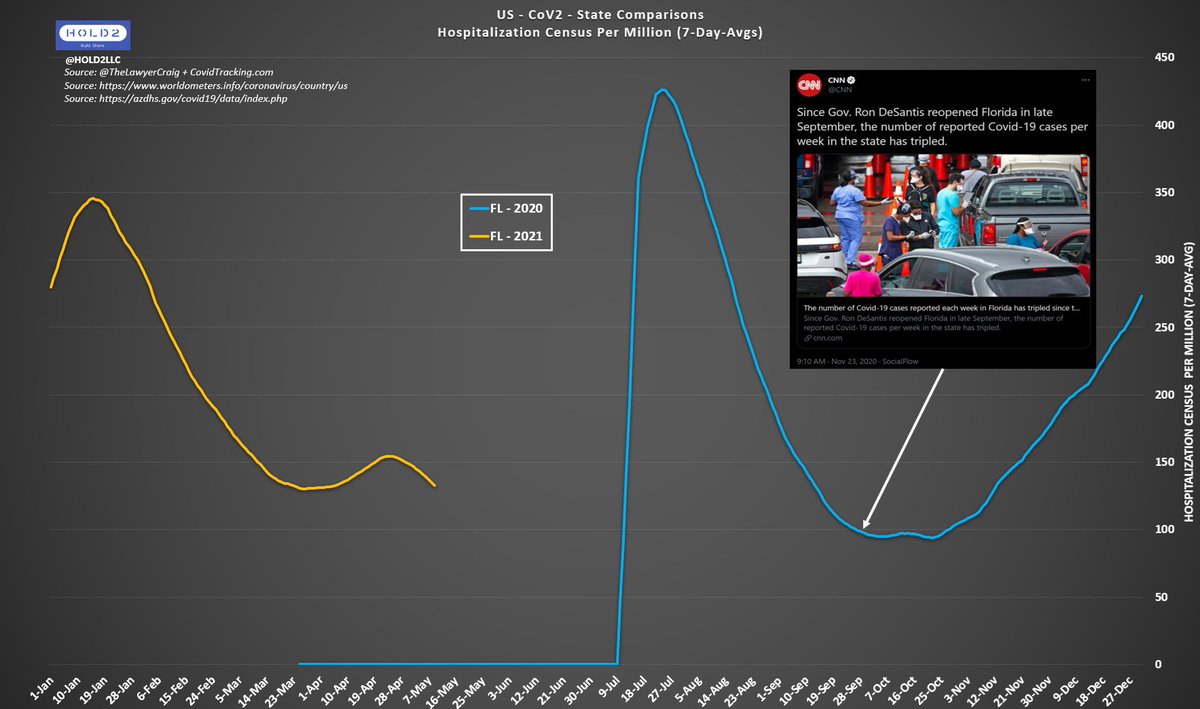
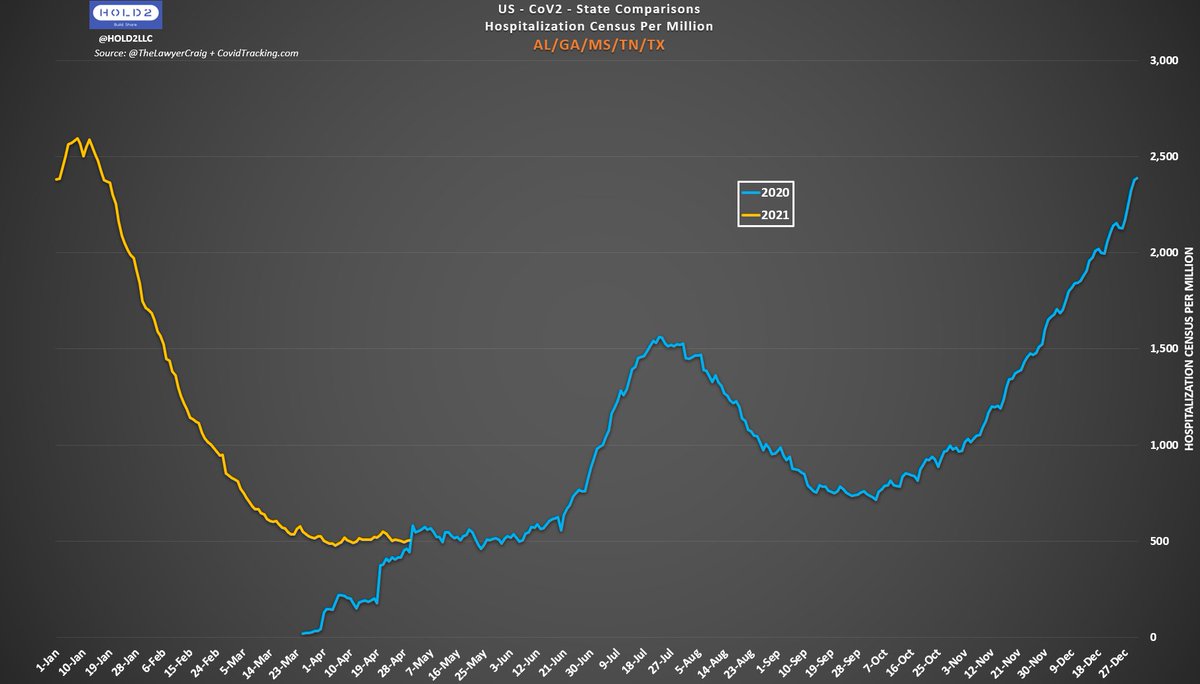
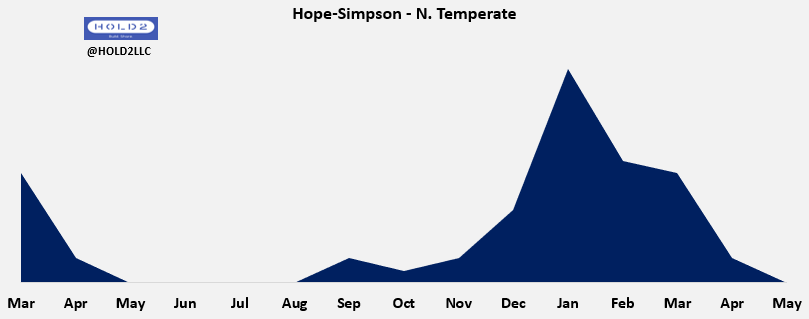
Hospitalization Census w/inflection points labeled.

Summer stimulus showing the same as Cases but with slight lag.

Amplitude increase should be minimal.

Spring Peak:
- 2020: 4/21
- 2021: 4/21

June Trough:
- 2020: 6/20
- 2021: 6/25-28?

Summer Peak:
- 2020: 7/27
- 2021: TBD
/2
Reported Deaths w/inflection points labeled.

This pattern is much less aligned than Cases/Hosps.

That April 2020 spike appears abnormal beyond just the effects of CoV2 itself.

Notice how much closer the current numbers are.

Probably will see another July 4 reporting trough.
Adding Test Positivity since that is typically a leading indicator.

Identical inflection points and time stagger as Reported Cases (8-9 days).

June Troughs:
- 2020: 6/9
- 2021: 6/18

I expect Pos% to become less meaningful as healthy and vaxxed people stop testing as much.

• • •

Missing some Tweet in this thread? You can try to force a refresh
 

Keep Current with Hold2

Hold2 Profile picture

Stay in touch and get notified when new unrolls are available from this author!

Read all threads

This Thread may be Removed Anytime!

PDF

Twitter may remove this content at anytime! Save it as PDF for later use!

Try unrolling a thread yourself!

how to unroll video
  1. Follow @ThreadReaderApp to mention us!

  2. From a Twitter thread mention us with a keyword "unroll"
@threadreaderapp unroll

Practice here first or read more on our help page!

More from @Hold2LLC

12 Jun
***Master NY BOE Unmask🧵***

I've created this to gather all the NY BOE letters being sent to Gov Cuomo and Legislature.

It started with Hauppauge, a Long Island district that was open 5d/wk ALL YEAR. Yes, even in NY. They set the pace.

This is Science. This is Leadership. ImageImage
Then Massapequa jumped in the ring for tag team support while adding their own #RationalGround verbiage:

"We respectfully request that you either provide the data and science that supports the universal masking of our children, or you lift the mask mandates for schools."

🔥🔥🔥 Image
Next, the floodgates opened.

A scorcher from William Floyd.

"...masks are causing anxiety and mental anguish, along with physical issues such as nosebleeds and trouble breathing..."

How many times have you heard, "what's the harm?" or "well my kid doesn't mind wearing one"? Image
Read 25 tweets
29 May
Lowest 10 States - COVID Mortality Year-Over-Year

This is Reported Death Per Million shown Year-over-Year for the 10 states with the lowest COVID mortality.
Oregon and Washington by themselves on the same scale.

Note that 1/M/Day is very low.
These charts show Hospitalization Census Per Million for 2 groups:

Chart 1) The 5 states with the highest COVID Mortality

Chart 2) The 5 states with the lowest COVID Mortality

Same scale.

Bottom 5 are higher than last year but overall extremely low. Peak barely above 100/M.
Read 5 tweets
9 May
US States CoV2 2020 vs. 2021: 5/9/21

Let's peek at some states compared to last year and current trends relative to NPIs.

Starting with AZ:
- Both Reported Deaths and Date of Death >50% lower
- Hosp Census 20% lower
- Positivity 36% lower despite Case Detection 84% higher
FL:
- Reported Deaths a little higher than last year but much lower than when all restrictions were removed
- Date of Death identical to last year as of 4/25
- Did not report Hosp Census until 7/10/20, but you can see the difference. Dropping quickly after a brief Spring stimulus
TX:
- Hosp Census higher than last year but down 56% since the Neanderthal comment and trending down
- Reported Deaths down 80% since the Neanderthal comment and trending down. Slightly higher than last year but converging
Read 4 tweets
1 May
CoV2 2020 vs. 2021: AL/GA/MS/TN/TX

🧐🤔

Not sure what to think.
AZ/CA/NV
NJ vs. CT/MA/NJ/NY/RI
Read 5 tweets
24 Apr
Thread on "Consilience" (tm @EthicalSkeptic)

I hope Dr. Jacobs will engage and discuss with us in good faith.

My intent is to explain how we analyze patterns and look for consilience before predicting or calling peaks.

It's important to know what to expect, right?

/1
This started with my tweet on 4/12 claiming MI/NY/NJ had peaked and that Hosps would peak next...likely the following week.

I didn't post that based on hopes and guesses. It was based on known data/patterns:
- Historical evidence
- Leading indicators

/2

Historical Evidence:

- Hope-Simpson N. Temperate pattern
- April 2020 pattern

Instead of assuming US states dropped in unison at the same time last Spring due to NPIs, we consider natural forces to be predominant.

/3
Read 8 tweets
12 Apr
Taking this one step further, you HAVE to watch this review of the JAMA study.

As a reminder, this is a CDC study claiming over 50% of transmission is caused by asymp (Fauci).

They use a model where they ASSUME asymp is 75% as infectious as symptomatic.
Lee paper (9):
- Viral load is similar between asymp and symp
- "Viral load is not the same thing as infectiousness or transmissability"

Johansson (JAMA author) used that to claim asymp infectious is 100% as much as symptomatic (fed into the 75% model assumption).

/2
Chaw paper (#15):
- Symptomatic was 2.7X as presymp and asymp COMBINED
- Presymp more infectious than asymp

Johansson counts this as asymp being 40-140% as infectious but that does not match the paper.

/3
Read 5 tweets

Did Thread Reader help you today?

Support us! We are indie developers!


This site is made by just two indie developers on a laptop doing marketing, support and development! Read more about the story.

Become a Premium Member ($3/month or $30/year) and get exclusive features!

Become Premium

Too expensive? Make a small donation by buying us coffee ($5) or help with server cost ($10)

Donate via Paypal Become our Patreon

Thank you for your support!

Follow Us on Twitter!

:(