The case for precious metals & commodities today.
Call it the tale of two destructive outcomes.
Let me elaborate.
👇👇👇
Call it the tale of two destructive outcomes.
Let me elaborate.
👇👇👇
For us, there is no doubt that the Fed is cornered into choosing between only two destructive outcomes.
On one side, it could decide to continue expanding its balance sheet to ensure subdued interest rates at the cost of setting off an inflationary problem.
On one side, it could decide to continue expanding its balance sheet to ensure subdued interest rates at the cost of setting off an inflationary problem.
Or, it could take the deflationary route by reversing its unprecedently loose monetary policy, due to overheating economic conditions, resulting in a reckoning moment for financial assets from record valuations.
We weight a much higher probability that the inflationary backdrop will take place in the next few years, accompanied by a low economic growth environment (i.e., a stagflation).
However, for now, let us consider the opposite course as a way of understanding the likely implications that investors may face.
The secular decline in money velocity is the key factor that feeds into the deflationary thesis.
The secular decline in money velocity is the key factor that feeds into the deflationary thesis.
The Japanese economy is a great case study for this.
While the Bank of Japan grew its balance sheet from 21% to 135% of its nominal GDP since 2000, the average annual increase in the country’s Consumer Price Index (CPI) was a mere 0.1%.
While the Bank of Japan grew its balance sheet from 21% to 135% of its nominal GDP since 2000, the average annual increase in the country’s Consumer Price Index (CPI) was a mere 0.1%.
Wages and salary growth remained muted under an aging population, which is still a problem today.
Also, the technological advancements we saw over those years tempered the price increases in consumer goods and services.
Also, the technological advancements we saw over those years tempered the price increases in consumer goods and services.
So now we ask, does such a deflationary set up even matter for precious metals investors?
Interestingly enough, despite all these deflationary factors, gold in Japanese yen terms drastically diverged from money velocity, appreciating over 3-fold in the last 2 decades.
Interestingly enough, despite all these deflationary factors, gold in Japanese yen terms drastically diverged from money velocity, appreciating over 3-fold in the last 2 decades.

When money velocity falls, the private sector’s willingness to hoard money, rather than spend it, is what tends to escalate deflationary forces in an economy.
To add to this problem, near zero interest rate policies also cause financial institutions to become reluctant to lend capital to private institutions.
We are seeing clear signs of that today.
We are seeing clear signs of that today.
Commercial and industrial loans are down 16% from a year ago, the largest annual decline since the global financial crisis.
Nonetheless, like any other well-formed macro view, one should never rely on just one analog.
There were plenty of examples in history of other economies that went through similar secular downward trends in money velocity but also faced inflationary problems.
There were plenty of examples in history of other economies that went through similar secular downward trends in money velocity but also faced inflationary problems.
Turkey and Brazil would be great examples.
Both economies suffered from significant currency devaluations while also experiencing the pressure of a rising consumer price environment.
Both economies suffered from significant currency devaluations while also experiencing the pressure of a rising consumer price environment.

Some folks would argue that using these two countries as a counter argument for the deflationary thesis would be rather inappropriate.
To be fair, we do not disagree.
To be fair, we do not disagree.
The size of these economies, their high levels of dollar denominated debt, or even the fact that both do not possess reserve currency status certainly are important considerations.
However, ignoring today’s vast list of inflationary drivers running at all cylinders also seems, to say the least, quite irresponsible.
Here are some of them to highlight 👇👇👇
Here are some of them to highlight 👇👇👇
1) $3.9 trillion added to the Fed’s balance sheet since January 2020, almost doubling its size.
2) The continuous need by policy makers to suppress interest rates and allow the government to spend WW2 size deficits while accumulating record amounts of debt, now at 140% of GDP.
2) The continuous need by policy makers to suppress interest rates and allow the government to spend WW2 size deficits while accumulating record amounts of debt, now at 140% of GDP.
3) The largest wealth transfer from the government to the people in history, with the net worth for US households, including the bottom 50%, increasing by the largest amount in history.
4) Over 10 yrs of under investments in natural resource industries creating a long-standing bottleneck in the supply of commodities.
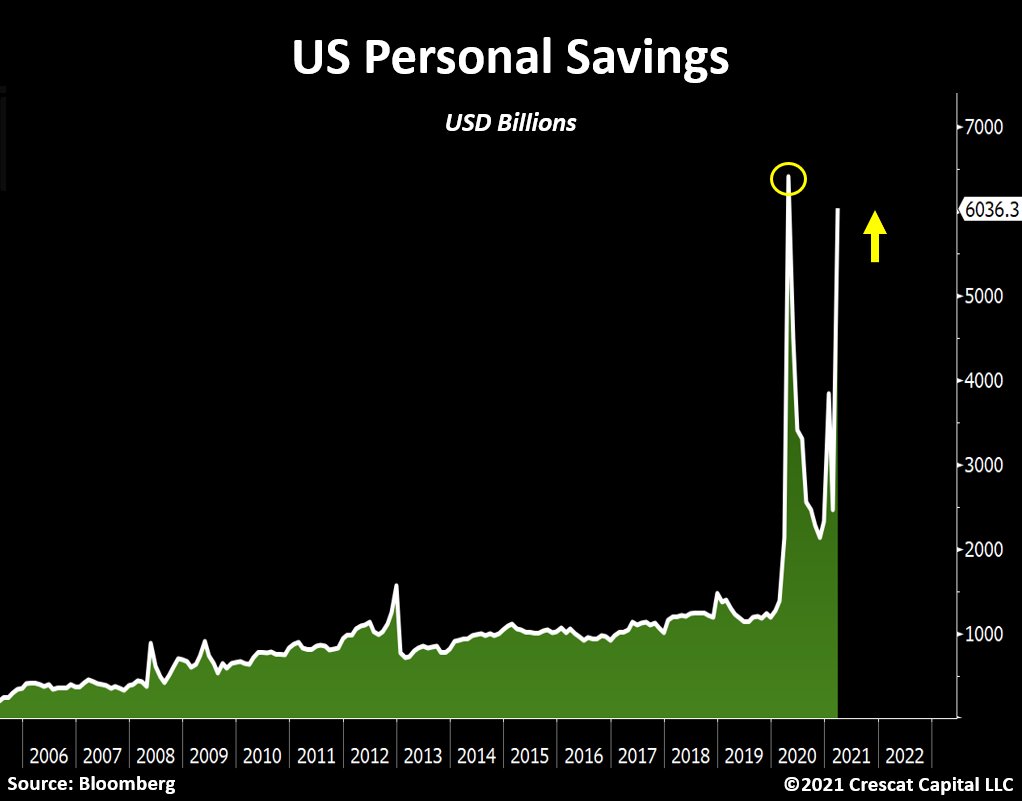
5) Significant amount of money in the sidelines with near $3T of accumulated personal savings, almost twice the size of the prior historical peak.
5) Significant amount of money in the sidelines with near $3T of accumulated personal savings, almost twice the size of the prior historical peak.
6) Lack of investments alternatives that yield more than inflation expectations hamstringing investors to seek historically cheap tangible assets, driving commodity prices higher.
7) Helicopter money policies creating severe implications with labor shortages.
7) Helicopter money policies creating severe implications with labor shortages.
8) A clear deglobalization trend developing with worsening US-China relations adding pressure on global logistics.
9) The likely beginning of an upward move in commodities from near historic low price levels.
9) The likely beginning of an upward move in commodities from near historic low price levels.
10) The hesitancy by major energy and metals producers to replenish their reserves through new exploration and development projects creating long-term implications in supply of raw materials.
11) The rise in popularity of the New Green Agenda and ESG principles constraining the exploration and production of certain commodities.
12) The willingness of policy makers to overshoot their inflation goals with extreme stimulative programs now happening worldwide.
12) The willingness of policy makers to overshoot their inflation goals with extreme stimulative programs now happening worldwide.
13) Companies being pressured to increase wages and salaries to attract workers to return to the labor market.
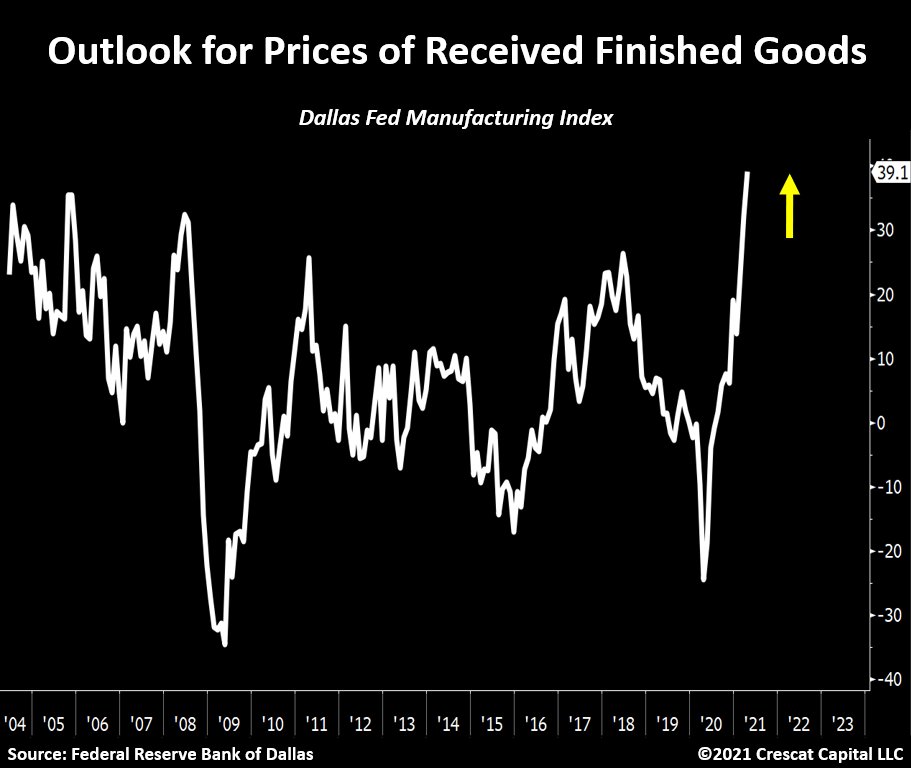
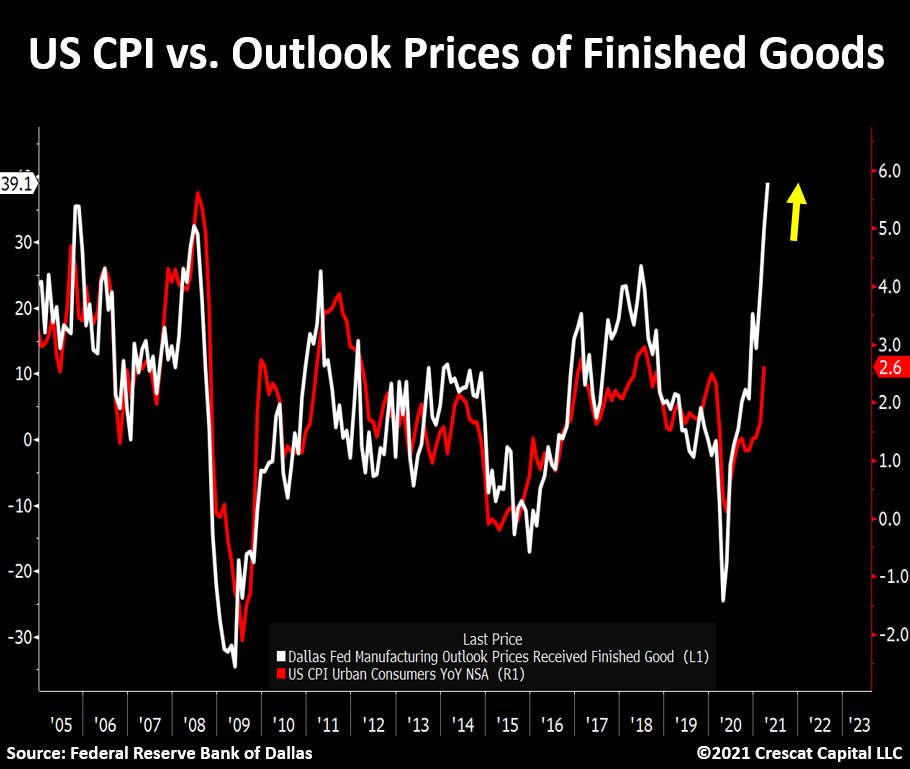
Also, to address the issue more directly, the rate of change of US money velocity has begun to turn up after such a steep decline.
Sure, it is still early to call the bottom, but it has indeed been moving towards the inflationary direction for the last 3 quarters.
Sure, it is still early to call the bottom, but it has indeed been moving towards the inflationary direction for the last 3 quarters.

What concerns us the most is the fact that policy makers have become exceptionally complacent when it comes to believing that today’s record monetary and fiscal stimulus will not translate into longer lasting inflation.
We happen to be on the other side of that bet.
We happen to be on the other side of that bet.
It is appalling how a Fed member with an inflation forecast of 2.5% for the end of 2022 is now considered hawkish these days.
What if we told you that the only transitory move we likely had was in the recent selloff in commodity prices?
We think the hoarding of tangible assets by investors is just getting started.
We think the hoarding of tangible assets by investors is just getting started.

It is a striking contradiction that the Fed decided to pivot the market narrative to its openness to tapering, though not raising interest rates until 2023.
Meanwhile:
The Fed just reported that it added the largest amount of assets to its balance sheet in over a year.
Nearly $200 billion in the last 4 weeks.
The Fed just reported that it added the largest amount of assets to its balance sheet in over a year.
Nearly $200 billion in the last 4 weeks.

As I said before, if we could use the perfect analogy to describe their message for raising interest rates into plain words, it would be:
“We are debating if we should start a diet 2 years from now”.
“We are debating if we should start a diet 2 years from now”.
Those assuming falling nominal yields indicate that inflation is transitory either have no clue that the Fed is buying $80 billion of Treasuries a month, or they just choose to ignore it.
More importantly, the fact that nominal yields rose recently in the face of larger purchases of Treasuries by the Fed, tells you why policy makers are truly trapped.

To conclude, let’s talk positioning:
The greatest long-term investments are those capable of performing well under opposing inflationary and deflationary economic forces.
The greatest long-term investments are those capable of performing well under opposing inflationary and deflationary economic forces.
Today’s abundance of macro, fundamental and technical reasons to be a gold investor have never been greater.
The ongoing monetary and fiscal disorder in the global economy underpins the onset of a secular bull market in precious metals.
The ongoing monetary and fiscal disorder in the global economy underpins the onset of a secular bull market in precious metals.
The last time real yields reached such low levels was in the 1970s when policy makers called for a war on inflation.
Today, they are welcoming it. It’s the most bullish macro set up for precious metals in over 50 years.
Today, they are welcoming it. It’s the most bullish macro set up for precious metals in over 50 years.

Aside from precious metals, we also like other tangible assets.
There are plenty of investors claiming commodities just reached a peak.
We are not in that camp.
It's important to zoom out and look at the profusion of reasons to own these assets.
There are plenty of investors claiming commodities just reached a peak.
We are not in that camp.
It's important to zoom out and look at the profusion of reasons to own these assets.
In an environment of rising inflation, where most financial assets are at record valuations and yield less than inflation expectations, commodities and natural resource stocks offer strong value properties and near-term high growth tailwinds.

The case for gold & silver mining companies also remains incredibly compelling.
-Triple digit free-cash-flow growth
-Insanely cheap valuations
-Strong balance sheet
-Profitability on the rise
And, on top of it, they are now historically oversold.
-Triple digit free-cash-flow growth
-Insanely cheap valuations
-Strong balance sheet
-Profitability on the rise
And, on top of it, they are now historically oversold.

And finally:
Gold and silver stocks are on track to report six straight profitable quarters for the first time in history.
The median free-cash-flow yield is at its highest level in 26 years.
Gold and silver stocks are on track to report six straight profitable quarters for the first time in history.
The median free-cash-flow yield is at its highest level in 26 years.

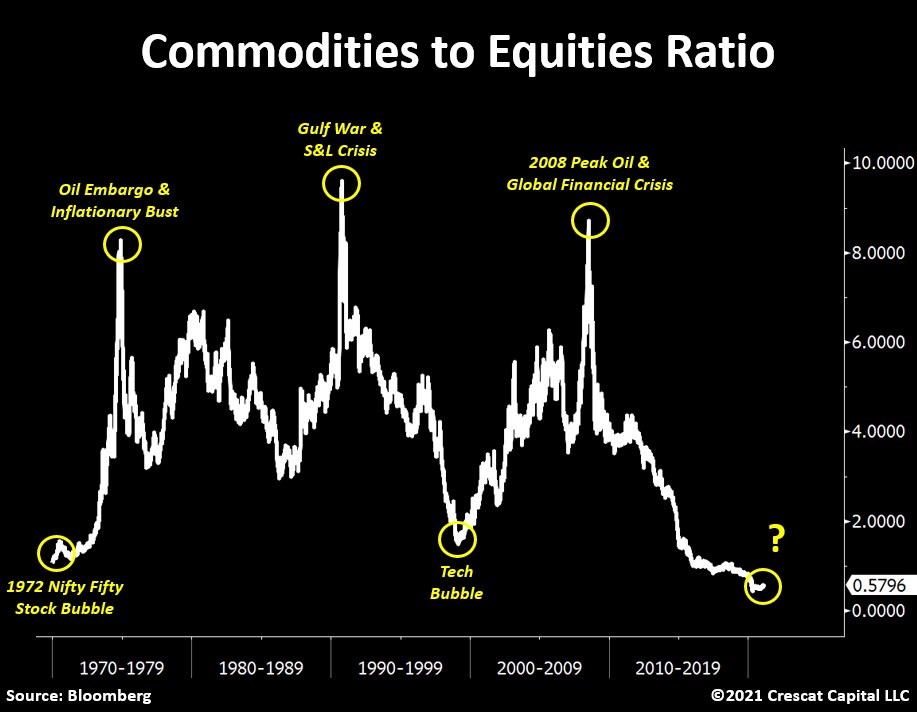
From a macro perspective, it all comes down to the chart below.
We think it’s prudent to be long commodities paired with short positions in the most overvalued parts of the equity market.
We think it’s prudent to be long commodities paired with short positions in the most overvalued parts of the equity market.
Hope you enjoyed this thread.
For more, see below our latest research letter:
“A Tale of Two Destructive Outcomes”
crescat.net/june-research-…
For more, see below our latest research letter:
“A Tale of Two Destructive Outcomes”
crescat.net/june-research-…
• • •
Missing some Tweet in this thread? You can try to
force a refresh