I will write a couple of points on #VOLUME. It's a #THREAD. I get a lot of questions regarding volume confirmation on chart patterns. Here is my story with volume as a supporting indicator.
I learned #technicalanalysis and charting with the default chart setup of volume at the bottom of each chart. I know how to read volume with price charts.
Around the subprime mortgage crisis and the financial meltdown, I was managing the largest fund in AUM in the UAE and a sizable one in the MENA.
The way I used to operate was, when I like a chart and a breakout, I never gave VWAP orders. I used the prepare our traders to go and buy everything at market. All the way to limit up.
At the end of the day we were sitting and trying to understand what part of the market constituted the rest of the volume. Did I result in the breakout or the market participated? Did it matter? Following days I used to capture nice trends.
I started paying less attention to volume. It seemed like a futile effort to try to understand what part of the day was whose volume. Wait more is coming...
Some stocks in the benchmark we followed constituted 10-15% of the index. MSCI or S&P (the index providers) used come out each quarter and rebalance their indices hoping that there will be enough liquidity for available funds to adjust course.
Result was either limit up prices or limit down prices. Discrepancies on volume patterns as everyone would pile into the new stock that was included in the index and exit/reduce the one that was excluded from the benchmarks.
This was another reason why I started paying less attention to volume patterns.
Many are obsessed with volume but in today's markets so much trading is taking place on derivatives and side markets. Do you think the volume patterns in stock exchanges are reflecting the real buying/selling?
As I consult some hedge funds today, I hear the same as they are trying to figure out which part of the volume they were and if they have impacted the price or it was the markets action.
So what I have concluded on volume is: It is good to have but not must have.

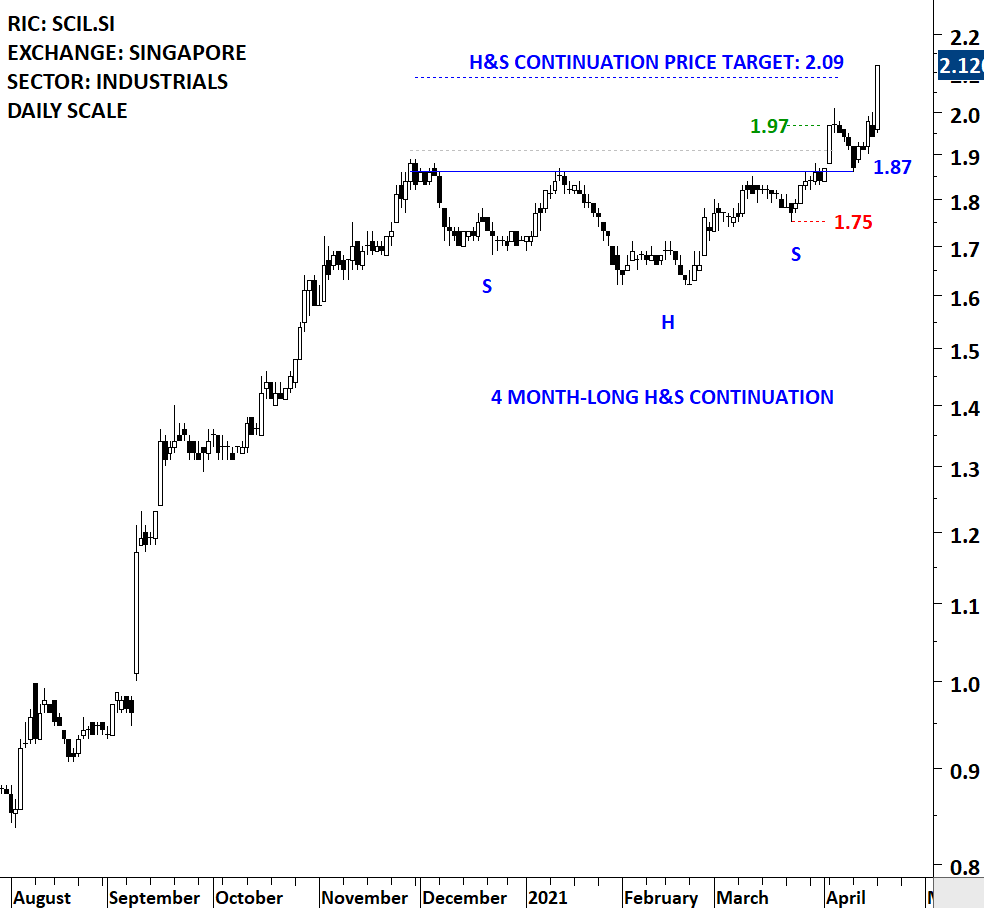
If a stock is breaking out with high volume, GOOD. If not, that is fine too. I've seen volume picking up at latter stages.

End of thread. Thanks for reading. Back to charts.

• • •

Missing some Tweet in this thread? You can try to force a refresh
 

Keep Current with Aksel Kibar, CMT

Aksel Kibar, CMT Profile picture

Stay in touch and get notified when new unrolls are available from this author!

Read all threads

This Thread may be Removed Anytime!

PDF

Twitter may remove this content at anytime! Save it as PDF for later use!

Try unrolling a thread yourself!

how to unroll video
  1. Follow @ThreadReaderApp to mention us!

  2. From a Twitter thread mention us with a keyword "unroll"
@threadreaderapp unroll

Practice here first or read more on our help page!

More from @TechCharts

9 Jul
Trying to pick tops and bottoms in a trend is a low probability event.
Identifying an existing trend and trying to capture the trend periods is a high probability event.

First you are going in the direction of the existing trend. There is momentum in your favor.

Second, you have "better" levels of stop placement incase you are wrong.
Better meaning, levels that are actually recognized by market participants as they are formed by the battle (supply & demand) during their transactions.
Read 4 tweets
7 Jun
$BTC One last comment on this: Unless you are quick to reverse position, do not trade the breakdown from the recent #symmetricaltriangle looking consolidation. Given that we are very close to the apex, it will not behave according to text-book. (1)
So what should you look for? What is the sweet spot?

I will look for: If breakdown from consolidation, a possible sell-off and a reversal candlestick around 30K. A doji, hammer, bullish engulfing? If I see one of those I will weigh the possibility of a bear trap. (2)
If there is a bear trap, given that we are still above the year-long average, that will offer a great entry with a stop below whatever the reversal candlestick can form (BIG IF). Treat with care. We are already few steps away from current conditions. (3)
Read 4 tweets
6 Jun
Reminder: Not all pattern breakouts will challenge you. Some will and some will rally to price target. The ones that will challenge you are unavoidable. Your main motivations should be to cut losses on the failed ones and try to capture the most in rallying ones.
In a strong market environment, you win rate can be ıncreased by focusing on bullish chart patterns. But that's it. The metric that you can control and will make the difference for you will be $ amount you make/$ amount you lose on average.
Given that there are so many moving parts and uncertainties involved, my suggestion is to simplify your trade identification and focus on select few patterns that you are comfortable trading.
Read 4 tweets
24 Apr
Btw, when I was managing funds in MENA, I was trading Saudi Arabia (bigger and liquid part of any MENA fund) and that was adding my work days to 6.

I feel for #cryptocurrency traders. You need some time to unwind, think, read & study. 7 days a week... come on.
For #cryptocurrency traders out there that are still in front of charts on a weekend, here are some updates for you, some well-defined ranges on select few:
$BTCUSD Rising wedge is still in play. 43K can become the target as a breakdown from wedge can retrace back to the beginning of wedge.
Read 9 tweets
19 Apr
Edwards & Magee discussed H&S acting as a continuation chart pattern with a 1936 example. Somewhere in between, new smart authors, thought new generation chartists that H&S can only form as a top or bottom reversal. WRONG.

I can show 100s of similar examples.
A recent #breakout #alert on $CCK
Another H&S continuation example, a recent #BREAKOUT #ALERT from #SINGAPORE reached its price target. SEMBCORP INDUSTRIES. More setups >> blog.techcharts.net
Read 4 tweets
23 Jan
The next 3 tweets will show you that all you need is a clean chart (no indicators) a ruler and a pencil to identify a possible trend period to profit from.

Before we start, our template:

1 year of data on daily scale
Candlestick chart
(my preference white background)
When you open your chart you will see this. Are you able to identify the lengthy and sideways consolidation?

Are you able to draw horizontal boundaries that will be a well-defined rectangle?

Consolidations are usually followed by trend periods. We want to capture that.
Did you draw the boundaries like this? Do we have several tests?
Read 8 tweets

Did Thread Reader help you today?

Support us! We are indie developers!


This site is made by just two indie developers on a laptop doing marketing, support and development! Read more about the story.

Become a Premium Member ($3/month or $30/year) and get exclusive features!

Become Premium

Too expensive? Make a small donation by buying us coffee ($5) or help with server cost ($10)

Donate via Paypal Become our Patreon

Thank you for your support!

Follow Us on Twitter!

:(