Does the #US10Y yield puzzle affect India? An earlier tweet covered the various angles to the US10Y yield puzzle. The perceived softness around #USgrowth appears to stand-out as a prominent reason. During the same time last week, we saw a sharp rise in the Indian 10Y...(1/12)
...yield to 6.18%. This appears to have been on the back of the #RBI's surprising (disappointing for traders/underwriters) choice of picking relatively illiquid papers for its new tranche of G-SAP 2.0. The announcement of a new 10Y benchmark paper auctioned on...(2/12)
...Friday, with a higher traded yield was another reason. Are the US and Indian bond markets related in anyway? The answer is an obvious yes. Given that the US is a key global driver, the #Fed's policy rates naturally push monetary policy of emerging markets and...(3/12)
...as a result, RBI policy rates. Therefore, one can loosely relate this directionally to that of yields. But it is important to note here that the US and Indian bond market yields have very different structural drivers. US treasuries have witnessed a secular bull...(4/12)
...market for nearly four decades. The same cannot be said for the Indian bond markets that have been more range-bound swinging within a range of 6% to 9%, with some brief breaches outside this range. Compared to US yields that have seen a secular decline in policy...(5/12)
...rates, an #EM like India has seen more cyclicality in policy rates. Indian yields move more closely to crude, liquidity, and inflation, broadly in that order. However, a post COVID yield appears to tag itself almost entirely to the RBI's language and its market...(6/12)
...presence. As a result, there is not much of a correlation that one can pin both yields down to. If one were to boil correlation between the IN10Y/US10Y down to a number, a 20Y correlation would seem to be as low as 7%. However, if one looks at correlations for...(7/12)
...shorter time periods or phases, one can arrive at higher 50-60%, 1-year correlations during specific phases. While this might not have much of a take-away, an interesting relationship that can be observed is that since the global financial crisis in '08, both...(8/12)
...US and Indian yields appear to have similar inflection points. These points of inflection, interestingly coincide with #crude price inflections as well. Having said all of the above, there does appear to be a broad #yieldspread that...(9/12)
...the Indian 10Y has with the US10Y. Since 2010, the IN10Y/US10Y spread averaged 5.3%, with the last 1Y average spread at 4.8%. Therefore, one can statistically read the sustainability of Indian 10Y yields based on how far-off their spreads are...(10/12)
...against the US10Y. The India/US spread has broadly seen a mean-reversion around this long-term average. And therefore, a very broad generalisation based on these spreads, would indicate an Indian 10Y to inch closer to a 6.6% (1.3%+5.3%). But...(11/12)
...again, these are just statistical derivations, devoid of market narratives and just some food for thought, on what data throws up.(12/12)
• • •
Missing some Tweet in this thread? You can try to
force a refresh
US inflation reaffirms 'transitory'. US inflation continued to rise and stood higher than expectations for a third month in a row. US inflation for the month of June stood at 5.4% y/y, much higher than market expectation of 4.9%. Core inflation also rose higher to...(1/8)
...4.5%, higher than the 4% consensus.
Why does this again reaffirm transitory for the Fed? This is mainly because the key drivers of inflation came from almost the same items seen in earlier months: used cars/trucks (45%), gasoline (45%), fuel oil (45%), utility...(2/8)
...gas service (16%) and transportation services (10%). These are almost entirely reflective of reopening of the economy and could moderate into the months ahead as the economy continues to normalise. July is a month when most of the US would be up and...(3/8)
Vaccines seem at work in the #UK. With every incremental day of contained deaths in the UK, the efficacy of the #vaccines in containing #COVID19 mortalities appears clearer. The infection and mortality curves in the UK make this fairly clear. While the infections curve...(1/6)
...in the UK continues to rise and is yet to see a peak, the daily fatalities have barely seen a pickup, compared to where it was the last time around. During the last wave, the mortality curve saw a pickup around a month or so after the infections curve. Looking...(2/6)
...at absolute numbers, the 7D average (7DAvg) of daily infections is now at 34k+ and the 7DAvg of daily deaths are at 30. During the last wave, on the rising part of the curve, when 7DAvg cases stood at 34k+ (25 Dec), the 7DAvg mortality stood at 480. This can be...(3/6)
Five things that can keep crude prices in check. The conversation around crude prices will not be complete till one takes a closer look at the supply possibilities. The last tweet touched about Iran. Note here that the end of Iran sanctions is expected to bring...(1/7)
...about a near-term increase of 0.5-0.7mbpd of Iranian crude into global supply. It is interesting to learn that Iran used to export 2.4 mbpd, compared to the current level of 0.1 mbpd. Now, the numbers get even more interesting when one looks at US shale. The...(2/7)
...break-even for shale is around $60/bbl and for some smaller shale sources like Bakken, the break-even is even lower at around $45/bbl. Therefore, the longer crude prices stay elevated, higher is the probability/incentive for shale production to make a comeback. Total...(3/7)
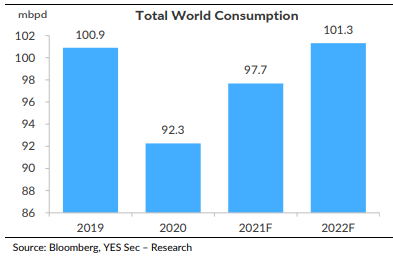
Can crude really touch $100/bbl?. After initial commentary globally around the probability of $100/barrel on crude, the narrative appears to be moderating a bit. The global oil market that was in a surplus of 2mn barrels per day (mbpd) in 2020 and turned into a...(1/6)
...deficit of (1.6)mbpd during the first six months of this year 2021. This deficit is an artificial one, on account of the production cuts imposed by the OPEC+ to keep prices elevated. Commentators appear to increasingly feel that crude could peak around $80/bbl. Higher...(2/6)
...spare capacities and the attractiveness of selling at elevated crude prices on the one hand could lead to an increase in supply on the sidelines. On the other hand, experts see a realistic possibility of Iranian crude resumption by the end of this year. While...(3/6)
Immediately after a sharp runup in crude, a drop appears to have puzzled some. The drop in crude appears to be largely on the back of a moderation in the earlier run-up in price. Heres a quick backdrop on the entire issue. During the pandemic, the OPEC+ countries...(1/12)
...agreed to production cuts that would span a broad 2Y period of May'20 to Apr'22. This was to keep crude prices from collapsing on the back of a sharp drop in demand caused by the pandemic. The production cuts peaked to around 10.3mn barrels per day (mbpd) in June'20,...(2/12)
...coinciding with the peak of COVID-19 globally. In Jul'20, it was agreed to taper the production cuts to 7.5mbps till Apr'21, as demand started picking up. All of this went broadly as per plan. In Apr'21 it was decided that the production cuts would be tapered...(3/12)
We need to learn to live with COVID-19 and its variants. This appears to be what bellweather economies seem to be saying. While we are all aware of the US opening up, almost entirely in July, Singapore, and UK stand out in particular. Singapore is moving away from a...(1/7)
...“Covid-Zero” strategy of completely stamping out the virus from its country through strong border controls/aggressive contact tracing/social distancing. Singapore is now moving to a strategy that focussess on reopening its economy through mass-vaccinations with...(2/7)
...a broad assumption that COVID-19 would not completely exit the country for the next few years. Singapore also senses that it is falling behind its western counterparts on the recovery trajectory. It plans to live with the virus that would be contained through...(3/7)