travellingtabby.com/scotland-coron…
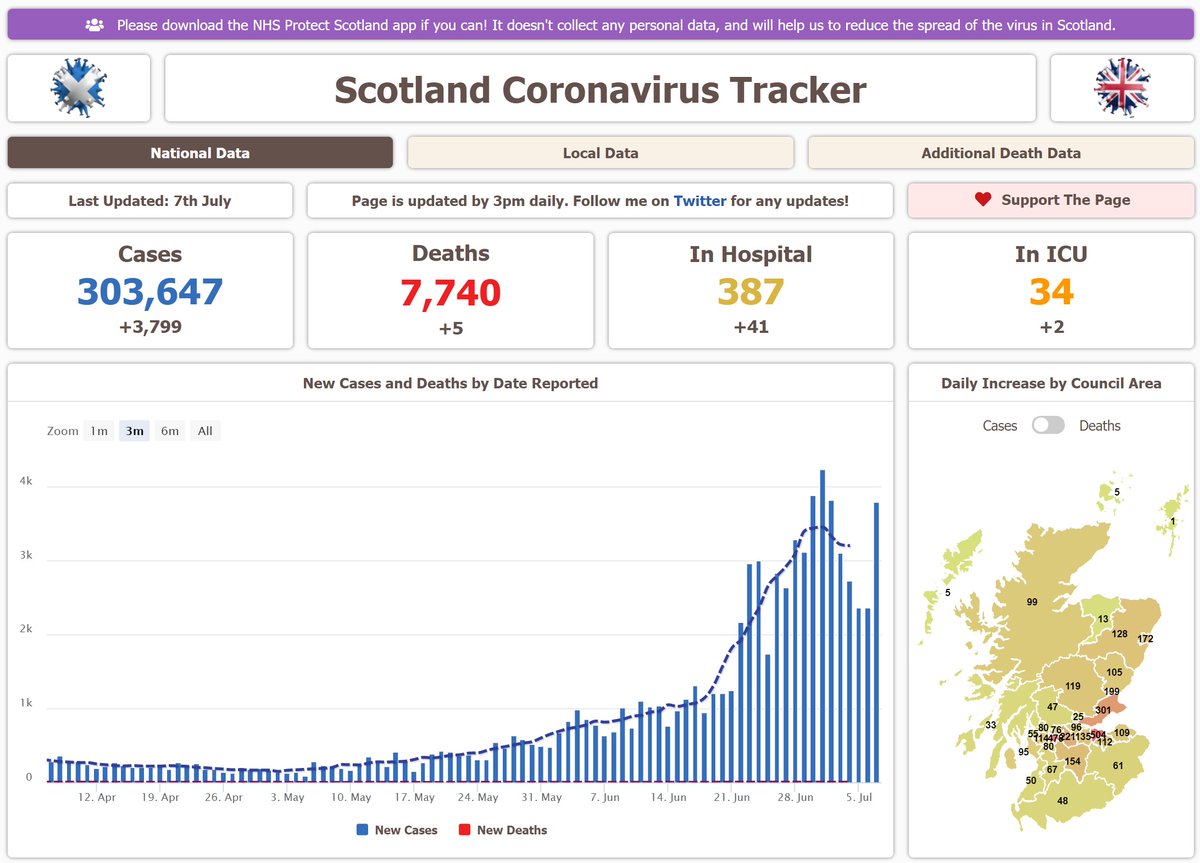
There were 11 new deaths reported today, which is the highest in a day since the end of March, unfortunately.
Also, I've included a thread below covering some of the figures over the past week! 👇
#covid19scotland #coronavirusscotland #DailyCovidUpdate
There were 11 new deaths reported today, which is the highest in a day since the end of March, unfortunately.
Also, I've included a thread below covering some of the figures over the past week! 👇
#covid19scotland #coronavirusscotland #DailyCovidUpdate


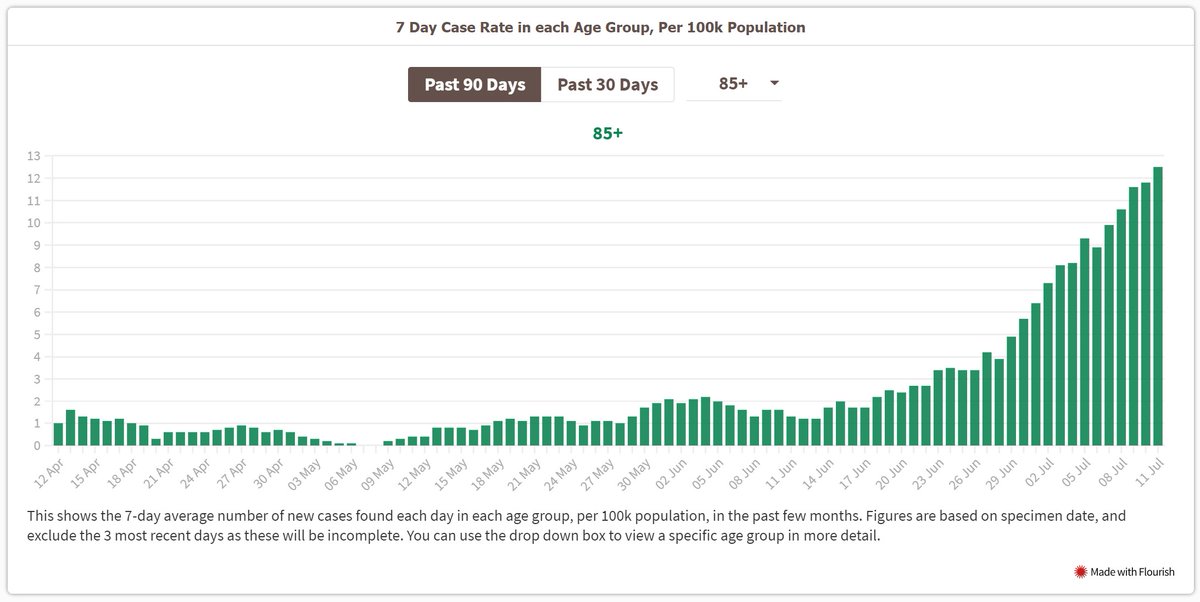
First, here are some figures on cases!
These are still falling, thankfully, which is good to see.
There have been some particularly rapid drops in the 20-24 age range, although the two oldest age ranges have actually been increasing a bit over the past week.
These are still falling, thankfully, which is good to see.
There have been some particularly rapid drops in the 20-24 age range, although the two oldest age ranges have actually been increasing a bit over the past week.


At a local level cases are now falling everywhere, other than in Moray and the three Island/Isle council areas.
Although those four areas have had the lowest rates over the past month anyways, so I guess they're more subject to an increase like this.
Although those four areas have had the lowest rates over the past month anyways, so I guess they're more subject to an increase like this.


The weekly PHS report (publichealthscotland.scot/publications/c…) has now started including figures on the vaccination status of positive cases!
As expected, the bulk of the cases we are seeing right now are coming from unvaccinated people.
As expected, the bulk of the cases we are seeing right now are coming from unvaccinated people.


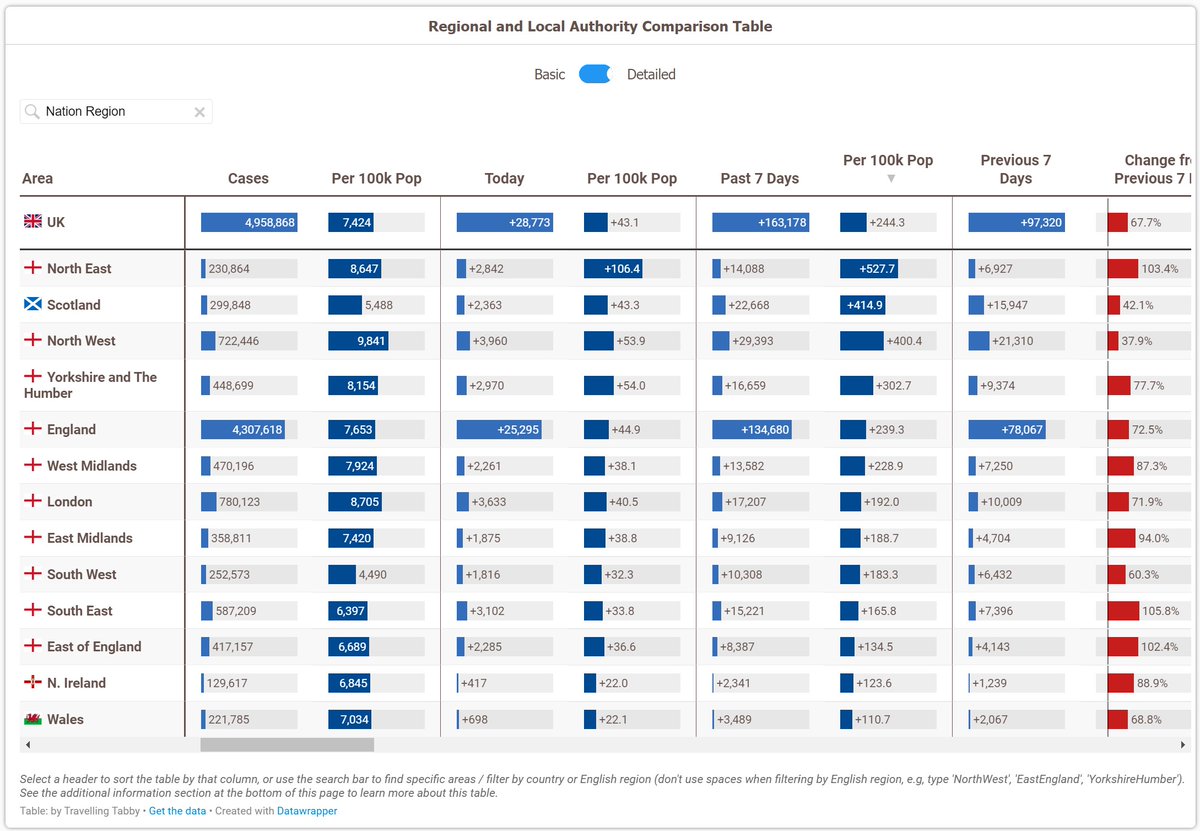
The positivity rate has been falling with cases, and the 7 day rate is now down to 9.6%, after a very unwelcome period of being over 10%!
While Midlothian currently has the highest rate of cases, Dundee still has the highest 7 day positivity rate, at 14.7%
While Midlothian currently has the highest rate of cases, Dundee still has the highest 7 day positivity rate, at 14.7%


Deaths are unfortunately still rising, with todays figure being the first double digit day since the 30th of March
Although the figures we're seeing right now are still low in comparison to what we would be seeing without the protection of the vaccines
Although the figures we're seeing right now are still low in comparison to what we would be seeing without the protection of the vaccines


The number of people currently in hospital/ICU, and the number of new admissions, are both still rising.
Although now that cases are declining this will hopefully come to an end soon too. I imagine (and hope) that these should peak in the next week or so
Although now that cases are declining this will hopefully come to an end soon too. I imagine (and hope) that these should peak in the next week or so


Here are some figures from the weekly PHS report regarding hospital admissions, both by vaccination status and then by age group
Proportionally, unvaccinated people have been the most likely to be admitted to hospital
Proportionally, unvaccinated people have been the most likely to be admitted to hospital


I have added this new chart to the page now, looking at the trends of cases/deaths/hospitalizations throughout the entire pandemic!
Each metric is on its own scale, and should let us see what effect the vaccines are having on weakening the impact of cases
Each metric is on its own scale, and should let us see what effect the vaccines are having on weakening the impact of cases


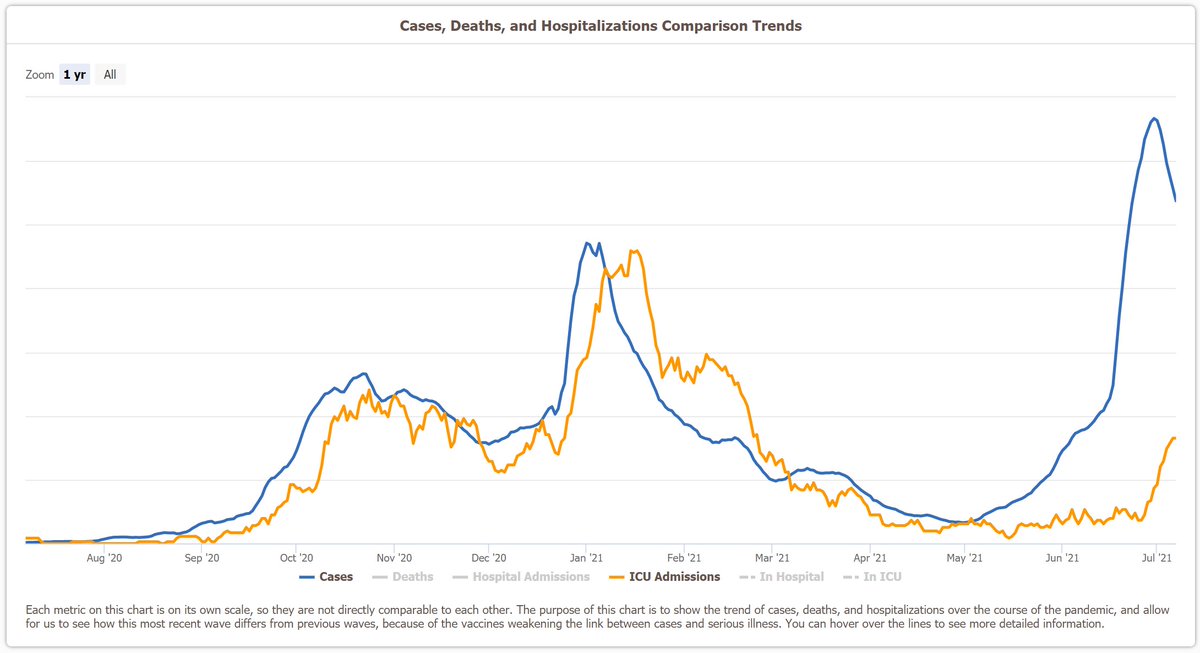

I know its annoying not having a numbered scale, but having six separate scales makes it too tricky to add them all in!
However you can still hover over/select a date to see a popup with more information in it, as below.
However you can still hover over/select a date to see a popup with more information in it, as below.


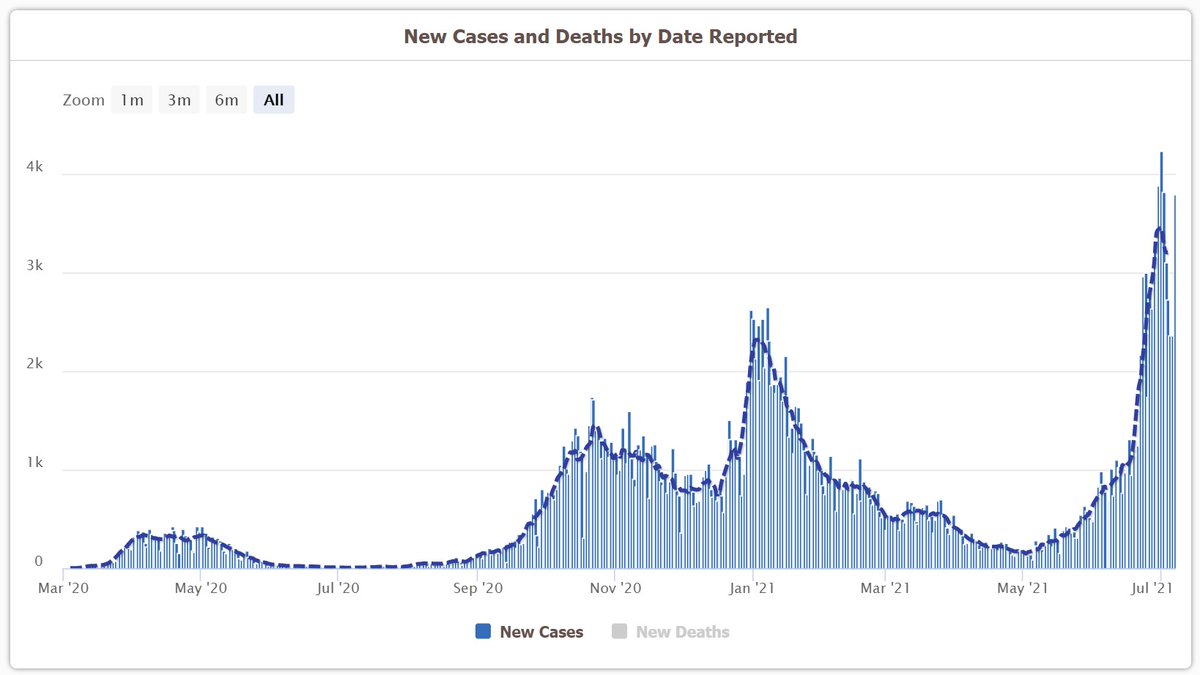
And I'll share this simple version here too!
Hospital admissions are still spiking up, I'm guessing because of the huge case spike we saw recently.
We're actually now having as many daily admissions as we were at our low point in December, before that awful surge came.
Hospital admissions are still spiking up, I'm guessing because of the huge case spike we saw recently.
We're actually now having as many daily admissions as we were at our low point in December, before that awful surge came.


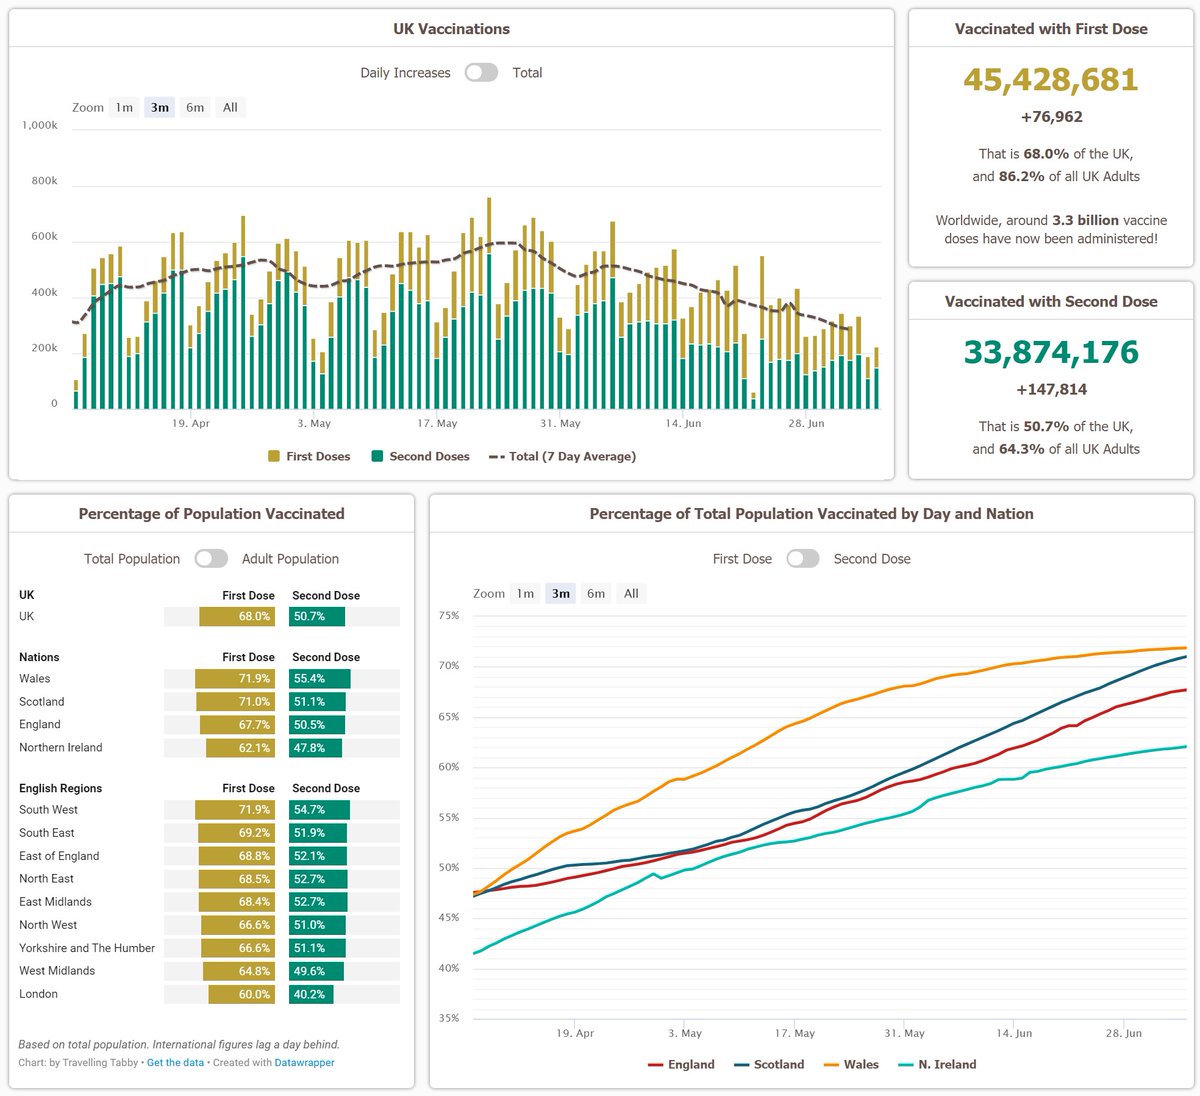
Anyways moving on from that, here are some of the vaccination figures!
Unfortunately the daily figures are still declining, presumably because we're just about getting to the end of our rollout. There aren't too many adults left to vaccinate anymore.
Unfortunately the daily figures are still declining, presumably because we're just about getting to the end of our rollout. There aren't too many adults left to vaccinate anymore.


Its worth noting that this isn't a Scotland specific issue, it is happening across the entire UK right now.
Wales are actually the only part of the UK ahead of Scotland right now. I think they're benefitting from their speedy first dose rollout, and can now do second doses
Wales are actually the only part of the UK ahead of Scotland right now. I think they're benefitting from their speedy first dose rollout, and can now do second doses


Anyways, here are some more specific first dose figures! 88.5% of Scottish adults (over 18) have now had their first dose!
But we can still go higher, hopefully to over 90%.
We're 'only' at 67% of 18-29 year olds, and 80% of 30-39 year olds, so there's more to be done.
But we can still go higher, hopefully to over 90%.
We're 'only' at 67% of 18-29 year olds, and 80% of 30-39 year olds, so there's more to be done.


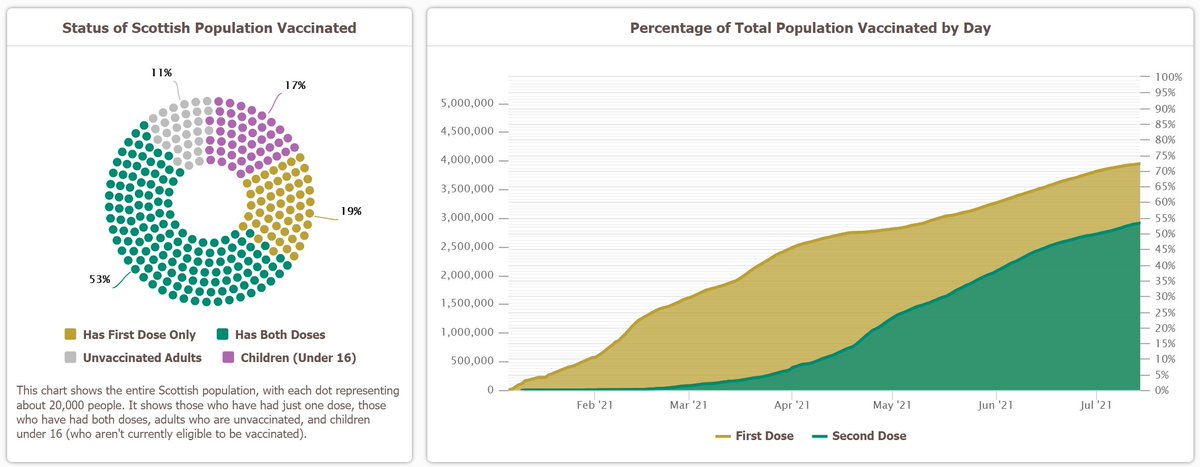
And then here are some of the second dose figures too! Obviously much lower coverage here, especially for younger people. But good progress is still being made


Also I thought I'd share this, which I was playing around with yesterday.
There isn't a figure for vaccinated 16/17 year olds, but there are ones for over 16s and over 18s, so you can sort of work it out!
Looks like around a fifth of 16/17 year olds are partially vaccinated
There isn't a figure for vaccinated 16/17 year olds, but there are ones for over 16s and over 18s, so you can sort of work it out!
Looks like around a fifth of 16/17 year olds are partially vaccinated

And here are some of the local/detailed vaccination figures too.
Moray is doing particularly well on their second doses right now, presumably benefitting from the speed up of first doses they had there back in May (that seems like forever ago now!)
Moray is doing particularly well on their second doses right now, presumably benefitting from the speed up of first doses they had there back in May (that seems like forever ago now!)


And lastly here are the weekly NRS death figures. 30 new deaths this week, which is up yet again.
Another week where the bulk of deaths were in Males too (70%).
Excess deaths were down a little, but still in the positive and a little above the normal range for this time of year
Another week where the bulk of deaths were in Males too (70%).
Excess deaths were down a little, but still in the positive and a little above the normal range for this time of year


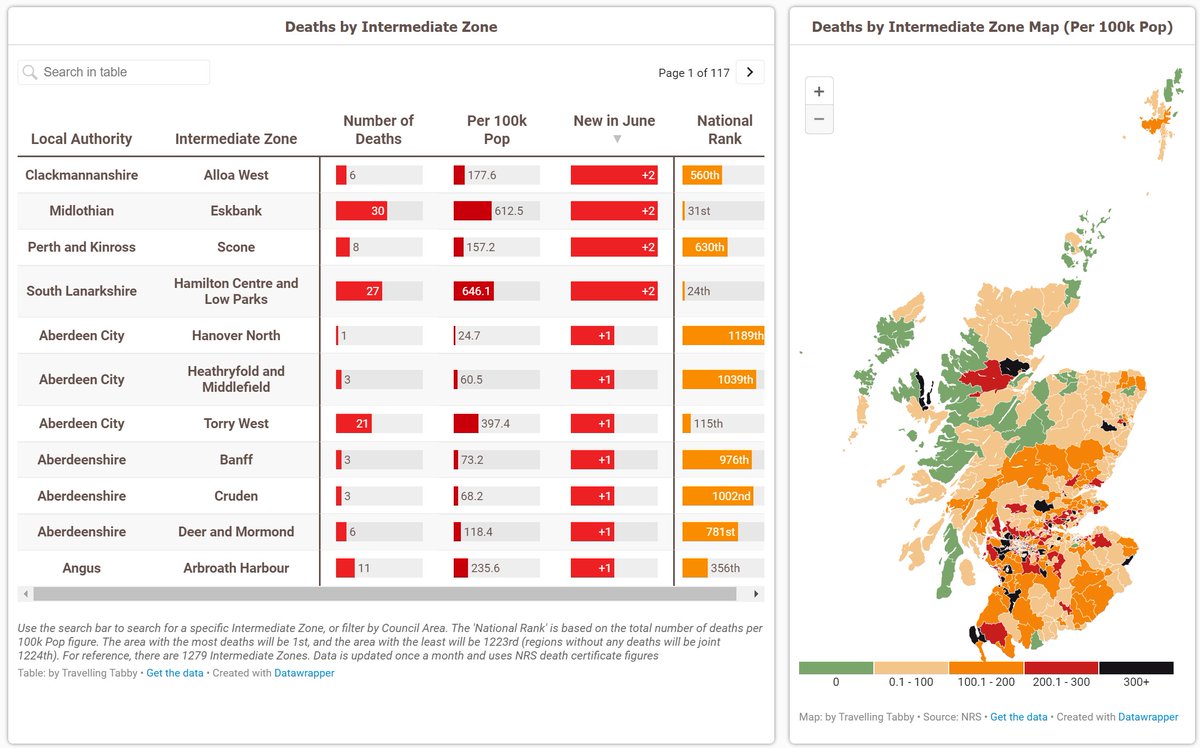
The NRS update this week (nrscotland.gov.uk/covid19stats) included a range of detailed figures, which are only included once a month. So here are some of those!
They include deaths by intermediate zone, excess deaths by cause, deaths linked to the vaccination, and more.
They include deaths by intermediate zone, excess deaths by cause, deaths linked to the vaccination, and more.


Here are some more figures too, showing the pre-existing conditions involved with the covid deaths we've seen


Anyways that is all!!
Its great to see cases still declining, although the continued rise in hospitalizations and deaths is not nice.
But at least we know that they are likely going to stop increasing over the next week or two, and start to fall again.
Its great to see cases still declining, although the continued rise in hospitalizations and deaths is not nice.
But at least we know that they are likely going to stop increasing over the next week or two, and start to fall again.
Or at least I can't see why they wouldn't! Unless of course cases spike up again, but lets hope that doesn't happen.
The weather is nice, schools are out, more people are getting vaccinated by the day, and masks are sticking around a while longer. That should all help us!
The weather is nice, schools are out, more people are getting vaccinated by the day, and masks are sticking around a while longer. That should all help us!
Also I'm going to try and add some other charts to the page over the coming week. I think just to try and display some of the new data being released now, regarding the vaccination status of cases/hospitalizations.
Plus maybe another few new additions and changes!
Plus maybe another few new additions and changes!
• • •
Missing some Tweet in this thread? You can try to
force a refresh