Want to do this kind of an analysis yourself? Lot of messages asking how to learn to do this. It's quite simple, let me show you step-by-step. (1/18)
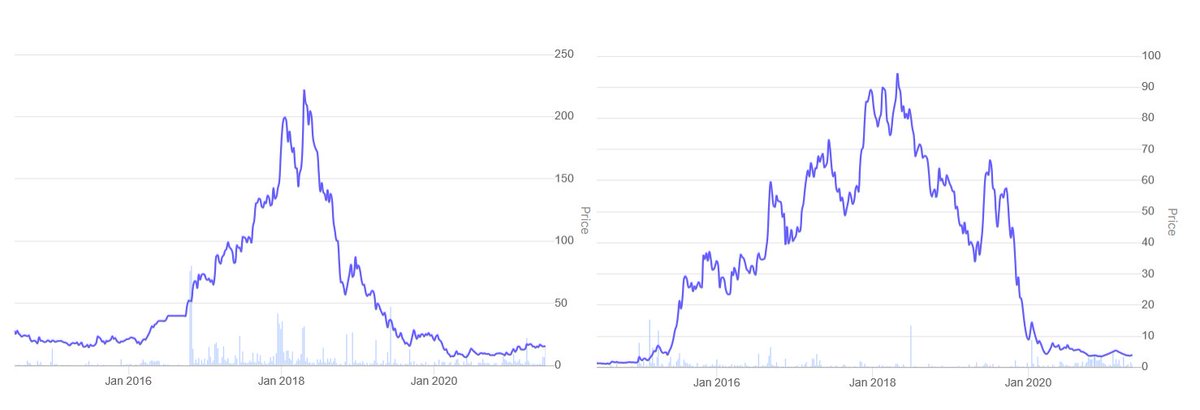
The first step, obviously, is spotting a candidate gives insights when the data is arranged in a particular manner. In the thread, I spoke of 'cash profits', so let's take the other example I cited - Welspun India Limited (WIL). WIL also likes to talk about cash profits. (2/18)
Next step, you need to get data. You can use any popular screener website that allows you to download data in Excel format. My default is @screener_in by @ayushmitt and @faltoo. I don't get any incentives for this mention, it is just easy to use. (3/18)
So, search on Screener and open the WIL page. You click 'Export to Excel' on top and download the document and open it. You will find many tabs for different aspects, only three are relevant here - cash flow, balance sheet and profit & loss. Start with the cash flow sheet. (4/18)
Delete the row 'cash flow from financing activities' (it has no relevance for analyzing maintenance capex). I also delete the FY21 column because I want to normalize data and FY21 had a large COVID impact variance. (5/18)
Go to the P&L sheet and copy the 'depreciation' row and the 'net profit' row and paste them in the cash flow sheet. Also take 'net block' from the balance sheet and copy it into the cash flow sheet. Your data set is ready. (6/18)
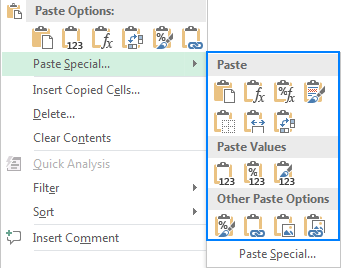
Do remember, when copying rows from across sheets, always use 'paste special' feature and select 'paste values'. You don't want to be copying formulae, that will lead to grossly incorrect data. This learning took an hour of head scratching, so....avoid it. (7/18)
Now, in the column after FY20 (say column K), you use 'Auto Sum' function in Excel to add up the values for every year. I do not do Auto Sum on net block because it is an incremental value. In the next column (say L), you use Auto Sum and select 'Average'. (8/18)
Last, in the next column (say M), compare FY16 w/ FY20 to see how things moved over the last 5 years. Formula is (FY20-FY16)/FY16. Don't worry, this is just simple math. You're done now. FYI - this is not a perfect measure, there can be one-offs or extraordinary items. (9/18)
Minor beautification later, you're ready to see the results:

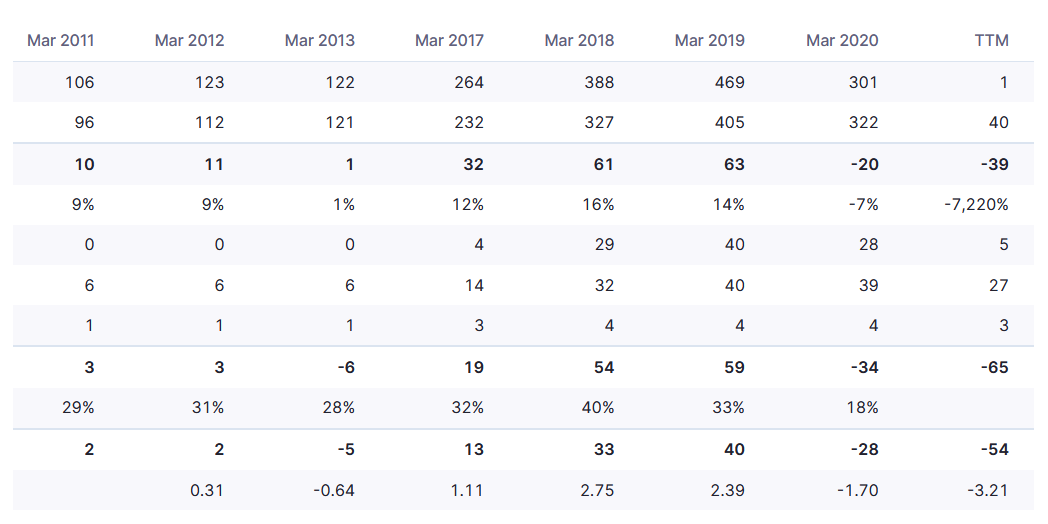
1. WIL generated 6567 crore in operating cash flows b/w 2012-20, but also invested 4641 crore into fixed assets. 70% of operating cash went into fixed assets. (10/18)
2. Depreciation was a mammoth 3600 crore, still lesser than the total addition of fixed assets at 4641 crore. Net block addition was much slower, growing 900 crore in 9 years. Effect of assets depreciating quickly and requiring replacement. (11/18)
3. On 5 year average, WIL generated 860 crore operating cash flow per annum, of which 560 crore required reinvestment, leaving ~200 crore cash for other business activities. Accounting profit, on average, was 439 crore per annum. Tax isn't even part of this calculation. (12/18)
This analysis is very dandy, but a reader might legitimately ask, can you show me a business that has seemingly grown beyond being constrained by maintenance capex? Yes, let's see KPR Mills. (13/18)
KPR Mill is an old favourite and analyzing its financials in a similar manner makes it apparent why it has outperformed other textile companies (a part of it also has to do with diversification into ethanol, just to be fair). (14/18)
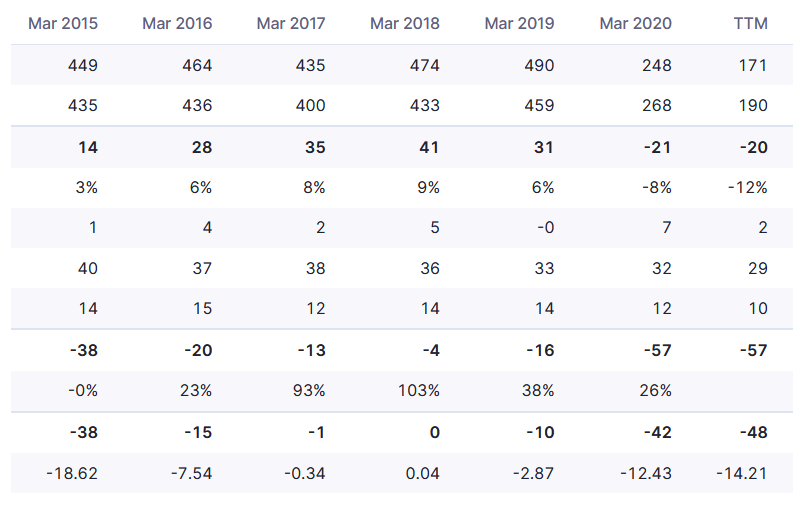
So, the Excel for KPR Mill. To keep this brief, first thing that jumps out is the flat/declining trend in depreciation with growing operating cash flows. Secondly, on 5Y basis, KPR's investment in fixed assets is ~45% of operating cash flows compared to 70% for WIL. (15/18)
KPR's trends that indicate it is able to generate more revenue on every rupee in fixed assets. The reasons can vary - better realizations, efficiency, supply chain, value addition, etc. These can be ascertained and validated through information from other channels. (16/18)
There are many different ways to analyze companies, and a lot more can be written on all these examples for a holistic analysis. However, the objective here is only to show how you can use simple tools and concepts to understand businesses and their trends. (17/18)
As always, none of this is a recommendation, only observations and perspectives. Do RT if you found it useful. (18/18)

• • •

Missing some Tweet in this thread? You can try to force a refresh
 

Keep Current with Leading Nowhere

Leading Nowhere Profile picture

Stay in touch and get notified when new unrolls are available from this author!

Read all threads

This Thread may be Removed Anytime!

PDF

Twitter may remove this content at anytime! Save it as PDF for later use!

Try unrolling a thread yourself!

how to unroll video
  1. Follow @ThreadReaderApp to mention us!

  2. From a Twitter thread mention us with a keyword "unroll"
@threadreaderapp unroll

Practice here first or read more on our help page!

More from @leading_nowhere

17 Jul
The bogey of maintenance capex – how the term ‘cash profit’ can be misleading for some types of companies but insightful at the same time. Read below⬇️
Some companies report ‘cash profits’ to measure financial performance. Two random examples - Time Technoplast (TTL) and Welspun India (WIL). TTL uses ‘cash profit’ in latest presentations but does not define it, whereas WIL defines it as profit before depreciation and tax. (2/22)
For TTL, I compared the 'cash profit' for FY20 from the Q4FY21 presentation, with the cash flow statement in AR FY20. The 'cash profit' for TTL seems to refer to cash from operations before working capital changes and tax. Quite hazy for the reader . (3/22)
Read 22 tweets
12 Jul
Yesterday I shared an observation on Oriental Carbon & Chemicals (OCCL), regarding their investments into VC funds and pre-IPO opportunities. A lot many wrote in with their views, so here are mine, with some international insights. (1/15)
OCCL is a very boring business - making insoluble sulphur, which is essential for vulcanizing rubber to make primarily tyres. Their latest annual report is very informative with respect to their strengths and market positioning, no need to re-invent the wheel here. (2/15)
Back when I first looked at OCCL several years ago, a colleague and I talked to some industry people to understand the indiustry structure. As anyone following OCCL will know, the market is mature and slow growing. The industry is capital intensive too. (3/15)
Read 15 tweets
27 Jun
Generally don't write about IPOs, but reading a new Red Herring Prospectus is habit. India Pesticides is an agro-chemical company with seemingly mouth-watering financial ratios. But corporate governance markers suggest extreme caution. (1/n)
What set off this inquiry was a disclosure in the RHP, indicating that the Company issued shares at Rs 33.70 to two individuals in February 2021 (4 months ago), who are related to a director. The IPO has recently closed with 23x subscription at Rs 295 per share. (2/n)
These two individuals were collectively alloted 371,380 shares for a consideration of approx Rs 1.25 crore, which would be worth close to Rs 11 crore after the IPO. That's a 775% increase in 4 months or 40,152% ROI annualized, assuming listing date as 05 July. (3/n)
Read 19 tweets
25 Jun
Whenever you consume content and need to draw conclusions from it, refer to Carl Sagan's Baloney Detection Kit. Twelve simple logical fallacies to watch. If you spot these, you are asking the right questions.

Full piece linked at the end👇 (1/13)
(1) ad hominem—Latin for “to the man,” attacking the arguer and not the argument (e.g., The Reverend Dr. Smith is a known religious fundamentalist, so her objections to evolution need not be taken seriously); (2/13)
(2) argument from authority (e.g., Nixon should be re-elected because he has a secret plan to end war in Asia—but because it was secret, there was no way for electorate to evaluate on merits; the argument amounted to trusting because he was President: a mistake); (3/13)
Read 14 tweets
24 Jun
Bizarre and brazen moves are common on the penny stock side of the stock exchanges. Vikas Proppant and Granite Ltd just released this intimation, announcing en-masse resignation of the entire management and board of the company to "bring in professional management". (1/7)
The shares of this company were heavily manipulated in the last 2 years, following the typical pattern of operators hand-in-hand with enabling management. Here's a look at the stock chart. Take a look at the volumes before the rise and the volume of trapped retailers after. (2/7)
Company has had almost no revenue in the last 3-4 years, except for a brief blip in 2019 when the stock prices also went up 6-8x in a very short span of time. In fact, it has been selling fixed assets this year. (3/7)
Read 7 tweets
17 Jun
Bull runs in small caps are usually fast and furious, and the cycle repeats itself every 3-4 years. Every time, retail is sold stories of business turnaround and stock charts look fantastic for meteoric wealth creation. For the class of 2020-21, here's a couple of past stars.
These small cap stocks with 30-40 crore market cap went up 23X and 11x in a span of 24 months between April 16 and April 18. The story looked great then, but subsequently once liquidity and interest disappeared, the prices went right back to where they came from.
When in the thick of the action, it can be difficult to keep a level mindset. To keep the narrative believable, these companies are able to massage their top-line and bottom-line for a short period of time to show an imminent turnaround. Note the trends in these financials.
Read 11 tweets

Did Thread Reader help you today?

Support us! We are indie developers!


This site is made by just two indie developers on a laptop doing marketing, support and development! Read more about the story.

Become a Premium Member ($3/month or $30/year) and get exclusive features!

Become Premium

Too expensive? Make a small donation by buying us coffee ($5) or help with server cost ($10)

Donate via Paypal Become our Patreon

Thank you for your support!

Follow Us on Twitter!

:(