THREAD #Inequality and heating homes 🏡
Xinru Lin used the latest @DWP 's Family Resource Survey (FRS) and Households Below Average Income (HBAI) microdata to explore who struggles to heat their homes and how this has changed over time in England (2011-2018). 1/6
Xinru Lin used the latest @DWP 's Family Resource Survey (FRS) and Households Below Average Income (HBAI) microdata to explore who struggles to heat their homes and how this has changed over time in England (2011-2018). 1/6

➡️ Households who were unable to keep homes warm fell from 6.6% to 5.8%, 2011-2018.
➡️ Households aged 35-44 and 45-54, fell by 4.4 and 4.6 percentage points. In 2018, households aged 65-74 no longer reported their inability to keep homes warm. 2/6
➡️ Households aged 35-44 and 45-54, fell by 4.4 and 4.6 percentage points. In 2018, households aged 65-74 no longer reported their inability to keep homes warm. 2/6

In 2018, the South West had the highest share of households, at 8.4%, who couldn’t afford to keep homes warm enough.
London (5%) and South East (5%) had the smallest proportion. 3/6
London (5%) and South East (5%) had the smallest proportion. 3/6

Among all households who couldn’t afford to keep homes warm in England, a greater share of them were in the North East (14.1%) and London (13.9%) compared to the average share in England (11%). 4/6
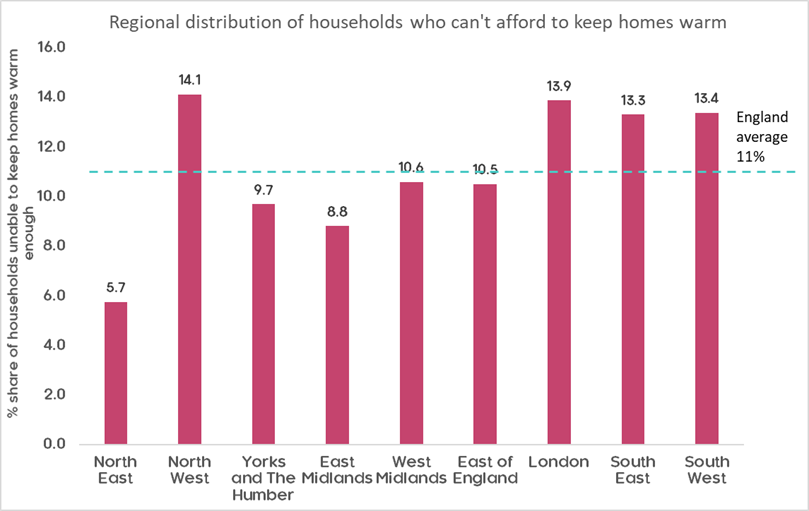
The data shows that the ability to heat homes is both a regional and generational issue.
Data from FRS and HBAI could be used to appreciate who and where the vulnerable groups are to understand the problem more specifically, and to develop targeted solutions. 5/6
Data from FRS and HBAI could be used to appreciate who and where the vulnerable groups are to understand the problem more specifically, and to develop targeted solutions. 5/6
Learn more about our work on inequality and poverty here: bit.ly/3dAO2K4 6/6
• • •
Missing some Tweet in this thread? You can try to
force a refresh