Global macro review
1/14
It’s a new month! 🐰 🐰
Let’s look back on July for positioning clues ahead
Notables:
$GLD ♉️
$TLT ♉️
$FXF ♉️
$CORN 🐻
$SILVER 🐻
$EEM 🐻
$DAX and $XLE teetering on 🐻
1/14
It’s a new month! 🐰 🐰
Let’s look back on July for positioning clues ahead
Notables:
$GLD ♉️
$TLT ♉️
$FXF ♉️
$CORN 🐻
$SILVER 🐻
$EEM 🐻
$DAX and $XLE teetering on 🐻
2/14
The UST curve flattened in July with 10/2s to 103.8 BPS. MOVE 61.19 +5.01%
2Y .188 -24.5%
5Y .694 -20.69%
10Y 1.226 -15.10%
30Y 1.895 -1.46%
Chart: $TNX peaked in March at 1.765% and since rolled over
The UST curve flattened in July with 10/2s to 103.8 BPS. MOVE 61.19 +5.01%
2Y .188 -24.5%
5Y .694 -20.69%
10Y 1.226 -15.10%
30Y 1.895 -1.46%
Chart: $TNX peaked in March at 1.765% and since rolled over

3/14
Bond ETFs ↗️ with curve flattening
$TLT +3.72%
$TIP +2.68%
$IVOL +2.52%
$IEF +1.99%
$BNDX +1.49%
$LQD +1.42%
$BND +1.17%
$HYG +-0.1%
Chart: Convertibles bucked the trend with $CWB -1.07%
Bond ETFs ↗️ with curve flattening
$TLT +3.72%
$TIP +2.68%
$IVOL +2.52%
$IEF +1.99%
$BNDX +1.49%
$LQD +1.42%
$BND +1.17%
$HYG +-0.1%
Chart: Convertibles bucked the trend with $CWB -1.07%

4/14
Equity volatility ↗️
$VXEEM 25.96 +37.94%
$RVX 25.79 +15.7%
$VIX 18.24 +15.22%
$VXN 20.81 +3.33%
Chart: $VXEEM emerging markets volatility ♉️ t + T
Equity volatility ↗️
$VXEEM 25.96 +37.94%
$RVX 25.79 +15.7%
$VIX 18.24 +15.22%
$VXN 20.81 +3.33%
Chart: $VXEEM emerging markets volatility ♉️ t + T

4a/14
🛑🛑🛑
Commensurate with ♉️ equity vol, $EEM is now 🐻 trade (t) -6.44% and trend (T) -4.41%
🛑🛑🛑
Commensurate with ♉️ equity vol, $EEM is now 🐻 trade (t) -6.44% and trend (T) -4.41%

4b/14
⚠️⚠️⚠️
Small caps are on the verge of breaking down with $RVX 25.79
$IWM closed -3.63% for the month and -1.71% for the past three months.
⚠️⚠️⚠️
Small caps are on the verge of breaking down with $RVX 25.79
$IWM closed -3.63% for the month and -1.71% for the past three months.

5/14
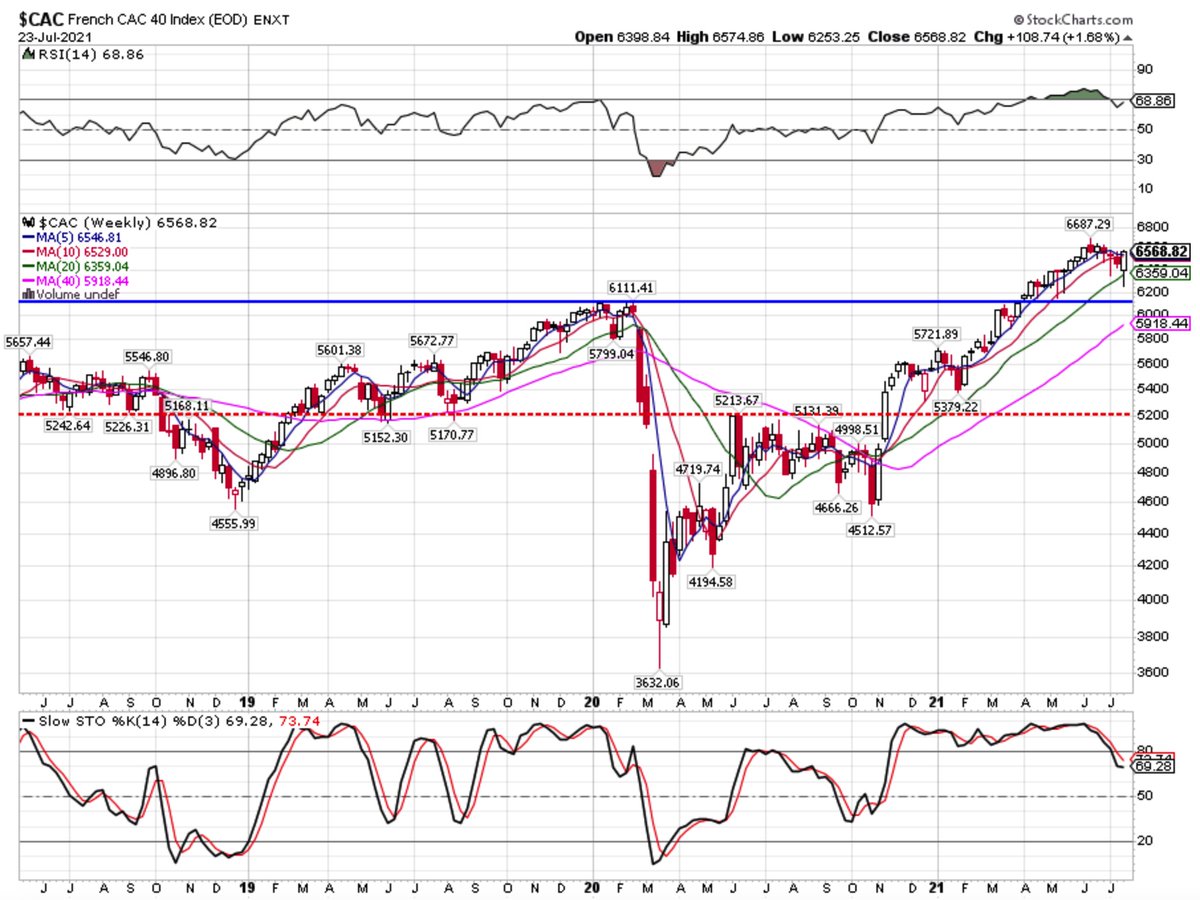
$SPX +2.27% ♉️ led global equities higher in July with Asia broadly ↘️
$CAC +1.61% ♉️
$COMPQ +1.16% ♉️
$DAX +0.09% < —> 👀
$KOSPI -2.86% < —> 👀
$HSI -10.13% 🐻
$NIKK -5.14% 🐻
$SSEC -5.4% 🐻
$TWII -2.86% 🐻
Chart: 👀 $KOSPI 3202 with a lower high has lost price momo
$SPX +2.27% ♉️ led global equities higher in July with Asia broadly ↘️
$CAC +1.61% ♉️
$COMPQ +1.16% ♉️
$DAX +0.09% < —> 👀
$KOSPI -2.86% < —> 👀
$HSI -10.13% 🐻
$NIKK -5.14% 🐻
$SSEC -5.4% 🐻
$TWII -2.86% 🐻
Chart: 👀 $KOSPI 3202 with a lower high has lost price momo

6/14
Top performing US equity sectors for July
$XLV +4.92%
$XLRE +4.62%
$XLU +4.33%
$XLK +3.89%
Worst sectors
$XLE -8.32% even with 💪🏻 $CVX $XOM earnings
$XLF -0.46%
$XLI +0.94%
Chart: 👀 XLE with trend at 48.89 ⚠️
Top performing US equity sectors for July
$XLV +4.92%
$XLRE +4.62%
$XLU +4.33%
$XLK +3.89%
Worst sectors
$XLE -8.32% even with 💪🏻 $CVX $XOM earnings
$XLF -0.46%
$XLI +0.94%
Chart: 👀 XLE with trend at 48.89 ⚠️

7/14
Country ETFs with strength in Northern Europe (non-oil producing)
$ENFL +5.28%
$EWD +4.33%
$EDEN +3.72%
$EWN +3.12%
Weakness is Asia
$FXI -12.5%
$EWZ -7.75%
$THD -6.22%
Chart: $EDEN +8.15% over T duration
Country ETFs with strength in Northern Europe (non-oil producing)
$ENFL +5.28%
$EWD +4.33%
$EDEN +3.72%
$EWN +3.12%
Weakness is Asia
$FXI -12.5%
$EWZ -7.75%
$THD -6.22%
Chart: $EDEN +8.15% over T duration

8/14
Metals ↔️ 👜
$COPPER 4.43% ♉️
$GOLD +2.57% ♉️ with $GVZ 15.09 -5.51%
$PLAT -2.28% 🐻
$SILVER -2.44% 👀 with $VXSLV 29.84 +1.26%
Chart: Unlike GOLD, SILVER is below T support of 25.87 ⚠️
Metals ↔️ 👜
$COPPER 4.43% ♉️
$GOLD +2.57% ♉️ with $GVZ 15.09 -5.51%
$PLAT -2.28% 🐻
$SILVER -2.44% 👀 with $VXSLV 29.84 +1.26%
Chart: Unlike GOLD, SILVER is below T support of 25.87 ⚠️

9/14
Despite OPEX+ shenanigans, hydrocarbons remain ♉️
$WTIC +0.65%
$BRENT +1.6%
$GASO +4.02%
$NATGAS +8.29%
Chart: Natty Gas +33.79% over T duration with notable decline in volume ⚠️
Despite OPEX+ shenanigans, hydrocarbons remain ♉️
$WTIC +0.65%
$BRENT +1.6%
$GASO +4.02%
$NATGAS +8.29%
Chart: Natty Gas +33.79% over T duration with notable decline in volume ⚠️

10/14
The most easily replaceable of commodities, grains ↔️
$CORN -7.35% 🐻
$SOYB -3.56% 🐻
$WHEAT +3.57% 🐻
$SUGAR +0.11% ♉️
Chart: $WHEAT 703.75 “looks” good, but < T level of 735 ⚠️
The most easily replaceable of commodities, grains ↔️
$CORN -7.35% 🐻
$SOYB -3.56% 🐻
$WHEAT +3.57% 🐻
$SUGAR +0.11% ♉️
Chart: $WHEAT 703.75 “looks” good, but < T level of 735 ⚠️

11/14
Strong hydrocarbons, mixed metals, and mixed ags pushed the $CRB +2.2% to another cycle high
Strong hydrocarbons, mixed metals, and mixed ags pushed the $CRB +2.2% to another cycle high

12/14
Fiat currencies spent the month chopping around with the 🇨🇭 emerging as the winner and 🇦🇺 the loser
$FXF +2.08% ♉️
$FXY +1.25%
$FXB +0.42%
$FXE -0.03%
$UUP -0.24%
$FXC -0.66%
$FXA -2.12% 🐻
Fiat currencies spent the month chopping around with the 🇨🇭 emerging as the winner and 🇦🇺 the loser
$FXF +2.08% ♉️
$FXY +1.25%
$FXB +0.42%
$FXE -0.03%
$UUP -0.24%
$FXC -0.66%
$FXA -2.12% 🐻

13/14
In summary:
New ♉️ in bonds
Equity vol ↗️
EM markets ↘️ 🐻
Small caps ↘️
Large cap US ↗️
#Quad4 US sectors ↗️
$GOLD ↗️
$FXF + $FXY ↗️ (safe havens)
$CRB ↗️
with $WTIC ↘️ and $COPPER ↘️ but $CORN ↘️
In summary:
New ♉️ in bonds
Equity vol ↗️
EM markets ↘️ 🐻
Small caps ↘️
Large cap US ↗️
#Quad4 US sectors ↗️
$GOLD ↗️
$FXF + $FXY ↗️ (safe havens)
$CRB ↗️
with $WTIC ↘️ and $COPPER ↘️ but $CORN ↘️
14/14
With $EEM and $IWM 🐻 and bonds ♉️, all 👀 on 🚧 of weakness $SPX & $COMPQ
Getting longer $GOLD and $TLT; shorting $EEM and cutting $RTY exposure.
👀 $XLE like a 🦅 with 💩 price action despite 🛢↗️
🐰 🐰 Have a 💰 August!
With $EEM and $IWM 🐻 and bonds ♉️, all 👀 on 🚧 of weakness $SPX & $COMPQ
Getting longer $GOLD and $TLT; shorting $EEM and cutting $RTY exposure.
👀 $XLE like a 🦅 with 💩 price action despite 🛢↗️
🐰 🐰 Have a 💰 August!
• • •
Missing some Tweet in this thread? You can try to
force a refresh