The next 2 to 3 weeks for #BTC are going to be the most critical in determining bull market continuation. Here I explain the exact technical and Onchain confirmations I would like to see for bull market continuation.

Thread
👇👇👇
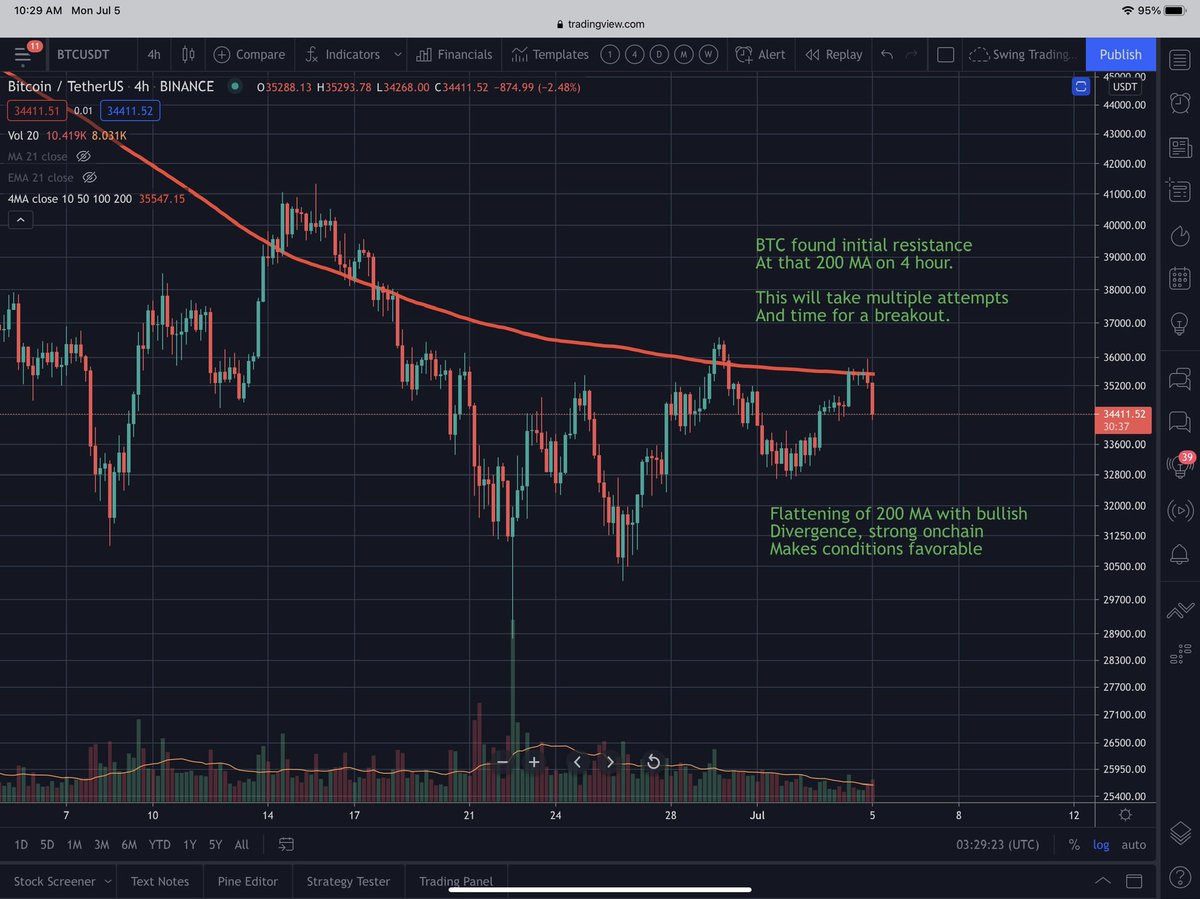
The first big step for #BTC is making a strong weekly close above the 21 week and 200 day MA. This will flash a very bullish technical buy signal, potentially causing a wave of capital to enter the market.
More importantly, after the first weekly close above major resistance at the 21 week and 200 day, we need to see follow through higher for the next 2 weeks, ideally breaking above 47k to 50k and entering the golden fib zone between 51.1k to 57.1k.
Previous bear markets that saw rallies up to the 200 day either saw resistance or a push above the 200 day and failure to follow through higher, leading to a break below the 200 day and lower lows. This is why I emphasize on the importance of follow through higher.
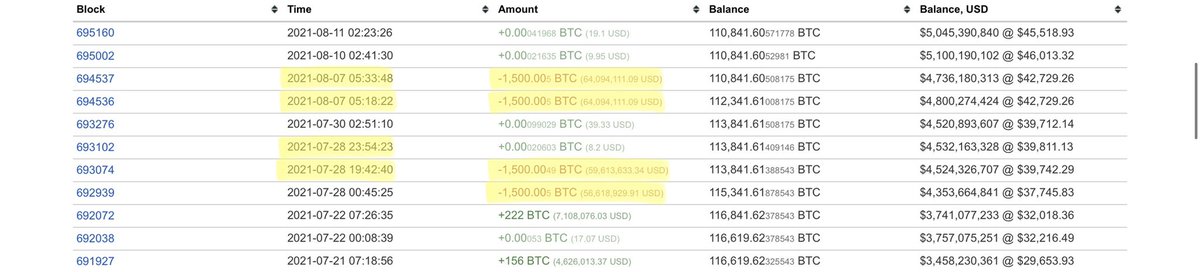
Whenever #BTC tests major resistance between 47k to 64k, I want to make sure Onchain is showing no signs of long term holders, large miners, and entities holding illiquid supply selling. If these cohorts start selling, the risk of a false breakout or downside increases.
Particularly in the next few weeks, if LTHs show little to no signs of selling this rally and technical breakout attempt, then I can see BTC pushing significantly higher, preparing to push towards 51.1k, 57.1k, and retesting ATHs at 64k. Supply exhaustion is a huge catalyst.
Near term I would like to see #BTC push above the local high at 46.7k, resistance at 46.8k, and start entering the realized price distribution zone between 47k to 50k.
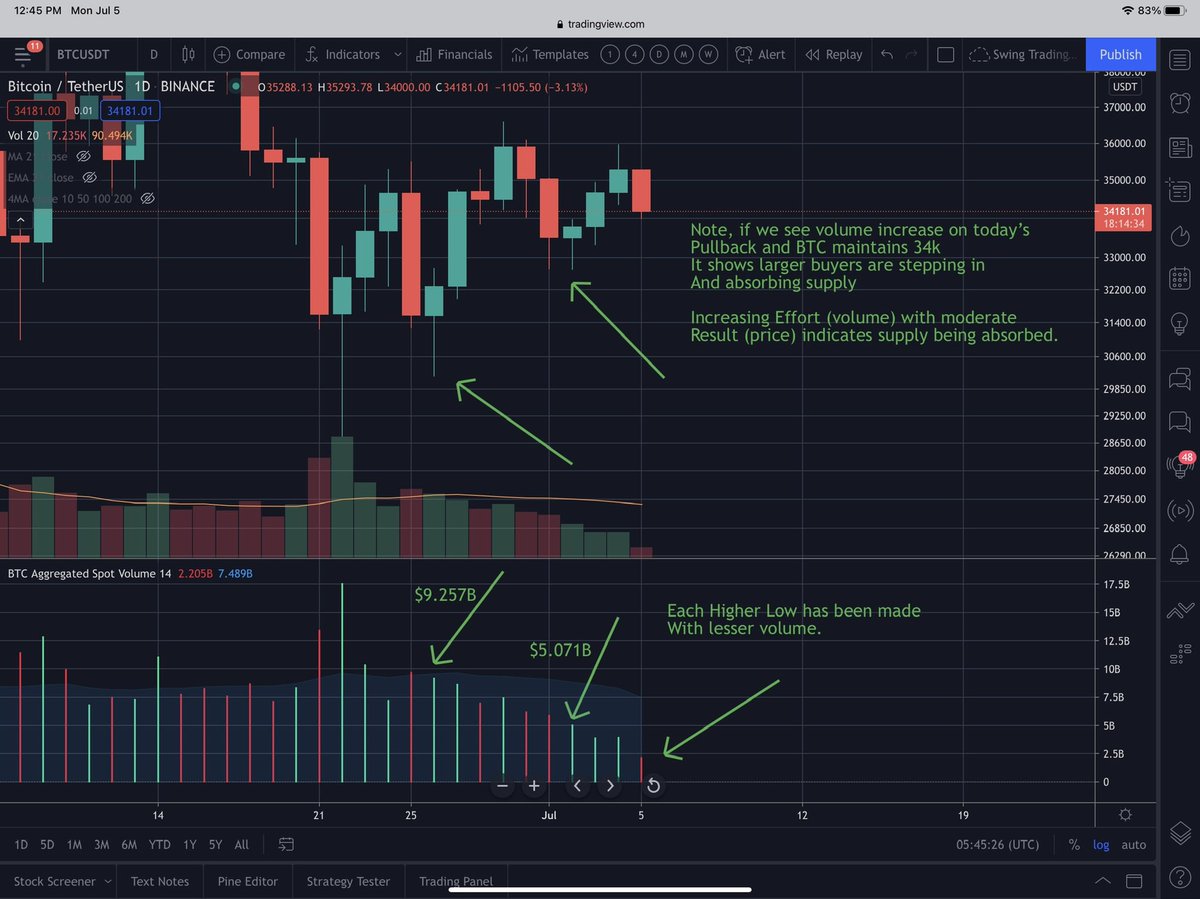
We need to see spot buying continue and absorb any supply coming into the market from previous buyers looking to break even or realize small profits.
The quicker #BTC takes out this 47k to 50k zone, the more bullish the technicals will look. The next zone to enter will be 51.1k to 57.1k which has another area of realized price distribution. So expect some more supply to enter the market.
At this point if there’s any major bullish catalysts such as a public company announcing a major purchase of #BTC, or a sovereign fund buying, this can easily push price higher if sentiment is bullish.
As long as Onchain shows no signs of LTHs selling, price should continue pushing higher as #BTC has been deep in supply exhaustion.
If we get bullish buy signals from the weekly close above the 21 week and 200 day, follow through higher, momentum continues to strengthen with the longer term buy signals flashing, and Onchain remains strong, this should prepare #BTC to retest ATHs.
#BTC never had a parabolic blow off top, many Onchain indicators never reached previous bull market peaks, the accumulation has been very strong, record amounts of new users are entering the network, and the strong hands are not selling this rally.
I believe #BTC has completed a Wave 4 correction from 64k to 28.8k and is now entering Wave 5, likely sending BTC significantly higher into the Q4 2021 or early 2022.
This data suggests #BTC is still in a bull market, and now we just need price confirmation for bull market continuation.
The biggest risk is LTHs starting selling in largest amounts, pushing price below the 200 day, causing a false breakout and price falls back into the trading range. Or BTC pushed side ways for months, 21/40 has a bearish crossover.
The Onchain data suggests this is less likely, but always possible. This is why we have to monitor Onchain data and watch the technicals for confirmation and validation.
Make sure you have a plan and do not rely on emotions when making investment decisions.
I am bullish as long as the data supports my view. If we see major sell signals flashing on technicals and Onchain, then I will turn bearish.
Long term, given the strong fundamentals, I can see #BTC reaching significantly over $500k this decade. Maybe even $1 million if fiat continues to plummet and the world transitions to #BTC as the global reserve asset. I can’t find a better asset. Long #BTC
If you enjoy my analysis, make sure to follow me for more updates!

• • •

Missing some Tweet in this thread? You can try to force a refresh
 

Keep Current with Daniel Joe

Daniel Joe Profile picture

Stay in touch and get notified when new unrolls are available from this author!

Read all threads

This Thread may be Removed Anytime!

PDF

Twitter may remove this content at anytime! Save it as PDF for later use!

Try unrolling a thread yourself!

how to unroll video
  1. Follow @ThreadReaderApp to mention us!

  2. From a Twitter thread mention us with a keyword "unroll"
@threadreaderapp unroll

Practice here first or read more on our help page!

More from @DanielJoe916

12 Aug
Here is PART 2 of my #BTC Price Target Series. This is my #BULL CASE price target for this #bullmarket. My targets are time based and condition based, while blending multiple forms of analysis. All opinions are my own, I am not factoring in other people’s price targets.

Thread
Disclosure: this is my opinion. This is not financial advice, DYOR. With that said, let’s jump in.
In order for #BTC to enter my #BULL CASE, we need to avoid seeing large selling pressure from long term holders, large miners, and entities holding illiquid supply especially if price is testing 100k. Low signs of selling pressure form these entities at 100k and ideal technical..
Read 14 tweets
11 Aug
As promised, here is PART 1 of my }#BTC price target thread. This thread is for my BASE CASE price target for #BTC on this #bull market. It is a time based, condition based target, which blends multiple forms of analysis. Think of it as a moving target.

Thread:
👇👇👇
Disclosure: this is my opinion. This is not financial advice, DYOR. I am keeping my proprietary methods private, as I have spent years researching and refining my analysis. Thank you for understanding. With that said, let’s jump in.
I use a variety of technical indicators and have my own proprietary methods to chart out highly confluent technical targets to the upside. I also apply sentiment indicators and onchain to help identify signals of euphoria and incoming selling pressure.
Read 12 tweets
11 Aug
Quick update on my thoughts on the third largest #BTC whale wallet. The lack of activity further suggests the recent selling is more likely to do with breaking even or realizing small gains on blocks of #BTC acquired in the upper 30s to low 40s.
This 🐳 lightly accumulated 753 #BTC starting at 50k on May 15th, at the start of the huge pullback. Additional purchases were made at 44.7k, 44.1k, with large buys going all the way down to 29.6k.
As #BTC continues the breakout attempt, I expect this 🐳 to sell small amounts of BTC especially if price approaches its cost basis for certain blocks at 50k.
Read 9 tweets
10 Aug
Here’s 3 charts showing near term relative performance of #BTC to the SPX, Gold, and the Dollar. #BTC is showing signs of strength when comparing recent performance.

Thread
👇👇👇
During the multi month #BTC consolidation, the SPX continue higher while #BTC underperformed. There was a large divergence forming between the SPX and #BTC. BTC staged an impressive breakout and has been significantly outperforming the SPX. Image
#BTC and gold’s recent price action show strong inverse correlation. It’s very interesting to see Gold drop significantly on a weekend, and #BTC push significantly higher on the same day. Image
Read 8 tweets
5 Jul
Weekly update #BTC
Long term technicals and Onchain remain bullish. The next 3 to 5 weeks will be critical in determining direction for BTC. It is very important for BTC to close back above the 21 week for bullish continuation and to avoid a bearish crossover on my 21/40 rule👇 Image
This weeks price action formed the Higher Low at 32.7k, with less volume, a positive signal indicating further supply exhaustion.

Near term we need to see #BTC push above and stay above 35.5k and 36.6k to help form the next higher high. Image
It appears #BTC is finding near term resistance at the 200 MA on the 4 hour chart. The 200 MA has been slowly flattening, signaling consolidation has been progressing and a potential set up for an attempt to push higher. (Chart from yesterday’s initial test) Image
Read 10 tweets
1 Jul
1/ Here is a more detailed breakdown of the Wyckoff Accumulation Schematic. #BTC has been giving early bullish signals on Supply/Demand, Buying Test Requirements and Effort/Result principles.

@100trillionUSD
@APompliano
Time for a thread
👇👇👇
2/ Here is the current chart of #BTC with each Phase marked. Current price action suggests #BTC just formed the Spring and Test in Phase C and is attempting to forming a higher high and higher low for validation. Image
3/ Test #2 consists of PS, SC, AR, and ST. Volume is expected to decline throughout the #trading range, a signal of less supply available, thereby weakening selling pressure. Also notice the near term downtrend being broken. Image
Read 19 tweets

Did Thread Reader help you today?

Support us! We are indie developers!


This site is made by just two indie developers on a laptop doing marketing, support and development! Read more about the story.

Become a Premium Member ($3/month or $30/year) and get exclusive features!

Become Premium

Too expensive? Make a small donation by buying us coffee ($5) or help with server cost ($10)

Donate via Paypal Become our Patreon

Thank you for your support!

Follow Us on Twitter!

:(