What happens when the #GOLD / #SILVER ratio (GSR) hits weekly RSI overbought (happened Friday)?
Well the results may surprise you. In PM bull markets it is extremely likely that silver rises WITH gold to close the disparity.
🧵 1/
$GDX $GDXJ $DXY $SIL $SILJ $GOLD
Well the results may surprise you. In PM bull markets it is extremely likely that silver rises WITH gold to close the disparity.
🧵 1/
$GDX $GDXJ $DXY $SIL $SILJ $GOLD
Here is a report on what has happened since 2002 when the weekly RSI reading of the gold/silver ratio reaches overbought. The RSI merely has to touch inside overbought, above 70, at the high of the weekly candle of this ratio. It does not have to close above overbought.
2/
2/
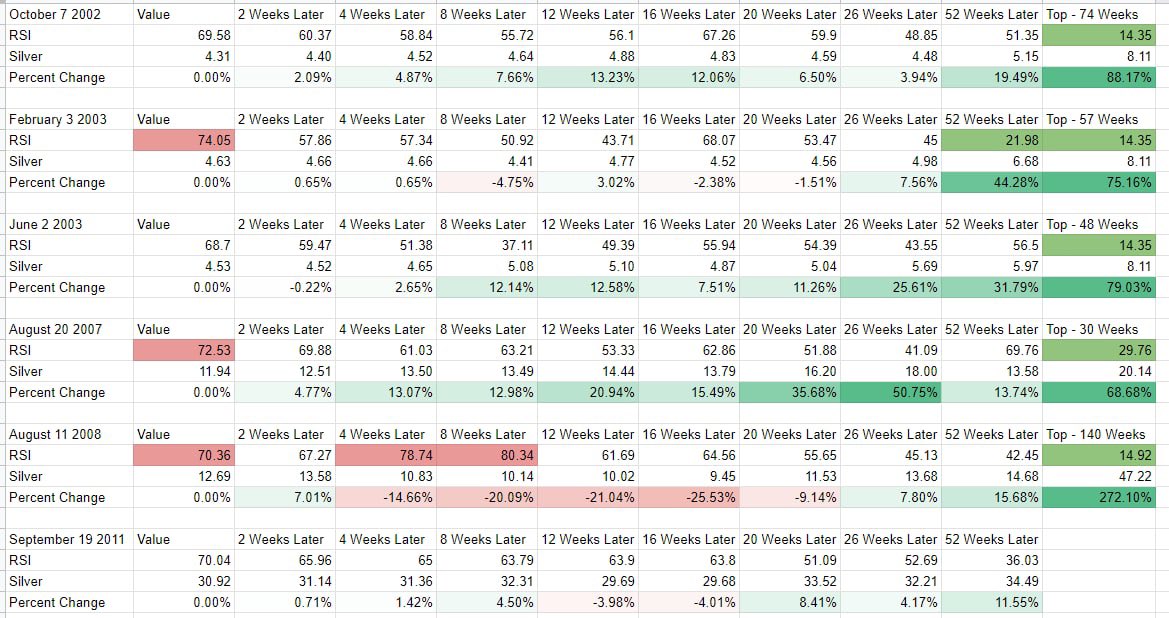
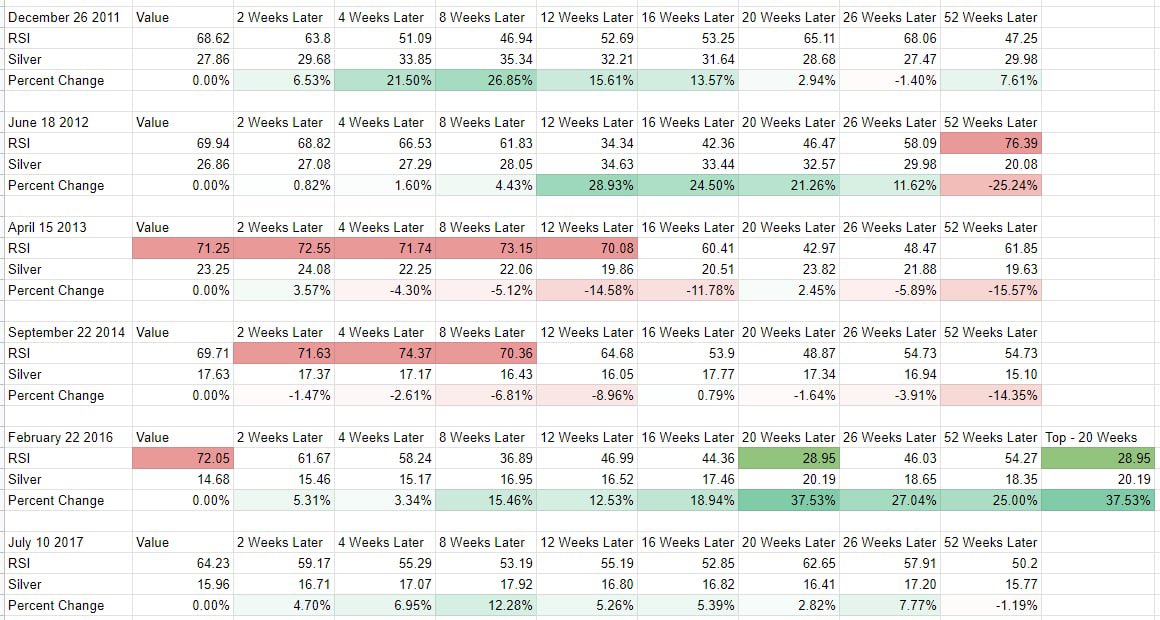
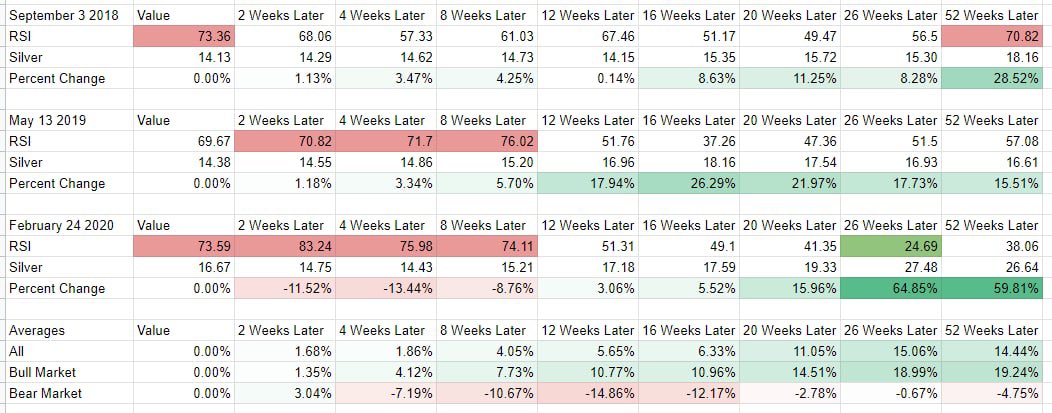
I show what happens 2, 4, 8, 16, 20, 26, 52 weeks after this occurrence to both RSI and the silver price. The percent changes of silver are the values that silver has changed in percent from the date of the first RSI overbought strike listed.
3/
3/
In the first 5 instances I show the ultimate top, that is, the first instance where the RSI of the gold/silver ratio reached oversold after the overbought reading. This was usually a huge trigger sell point to get out of silver all together before an imminent 30-40% correction
4/
4/
The final picture shows the averages, and also splits them between bull and bear markets to isolate the performances.
On Friday the GSR weekly candle closed above RSI overbought at about 70.30.
In PM bull markets silver rises faster than gold from these conditions, both up.
/5
On Friday the GSR weekly candle closed above RSI overbought at about 70.30.
In PM bull markets silver rises faster than gold from these conditions, both up.
/5
Also to note, the gold / #oil ratio hit daily RSI overbought Friday. The results are similar for this metric in that both gold AND oil eventually rise together (and fast), but with oil outpacing gold to close the disparity.
/fin
/fin
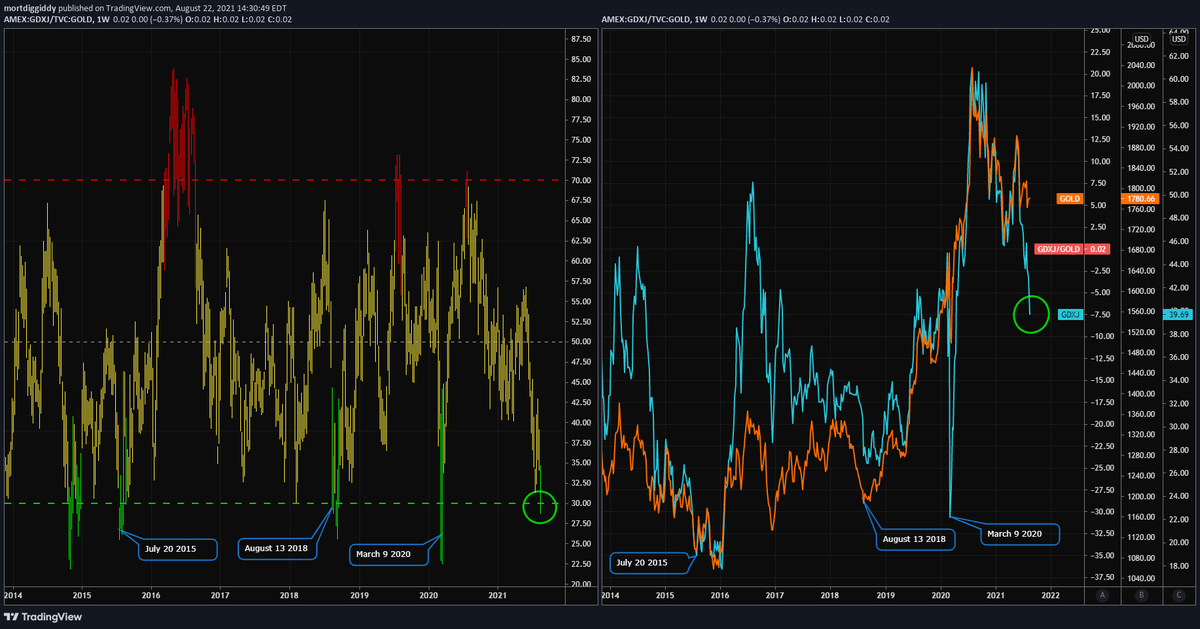
One final thing to note here, the weekly $GDXJ / #GOLD ratio closed below RSI oversold Friday, $GDX / $GOLD is also not far away.
The huge disparity is all due to miner selling. Likely miners resolve to the upside in short order.
Left: GDXJ/GOLD RSI
Right: price
#SILVER $SILJ
The huge disparity is all due to miner selling. Likely miners resolve to the upside in short order.
Left: GDXJ/GOLD RSI
Right: price
#SILVER $SILJ
• • •
Missing some Tweet in this thread? You can try to
force a refresh