Cédric Scherer Profile picture
Sep 23, 2021 10 tweets 8 min read Read on X
📊🧵 Collection of tweets featuring open-access materials that I have shared over the last years:
Talks, seminars, blog posts, hands-on notebooks, codes, and more!
#rstats #ggplot2 #tidyverse #dataviz 🧙‍♂️


Title slide of my "ggplot Wizardry" talk at Outlier conference 2021.
Final visualization of my "Evolution of a ggplot2" blog post.
Overview of plots contained in my "A ggplot2 tutorial for beautiful plotting in R"
Title slide of my "Beyond Bar and Box Plots: Chart alternatives and how to design them with ggplot2" talk for USGS
"#ggplot2 Wizardry: My Favorite Tricks and Secrets for Beautiful Plots in #Rstats" — talk + coding session at #Outlier21
"#ggplot2 Wizadry: Extended Edition" — talk and coding session at @OURmeetup
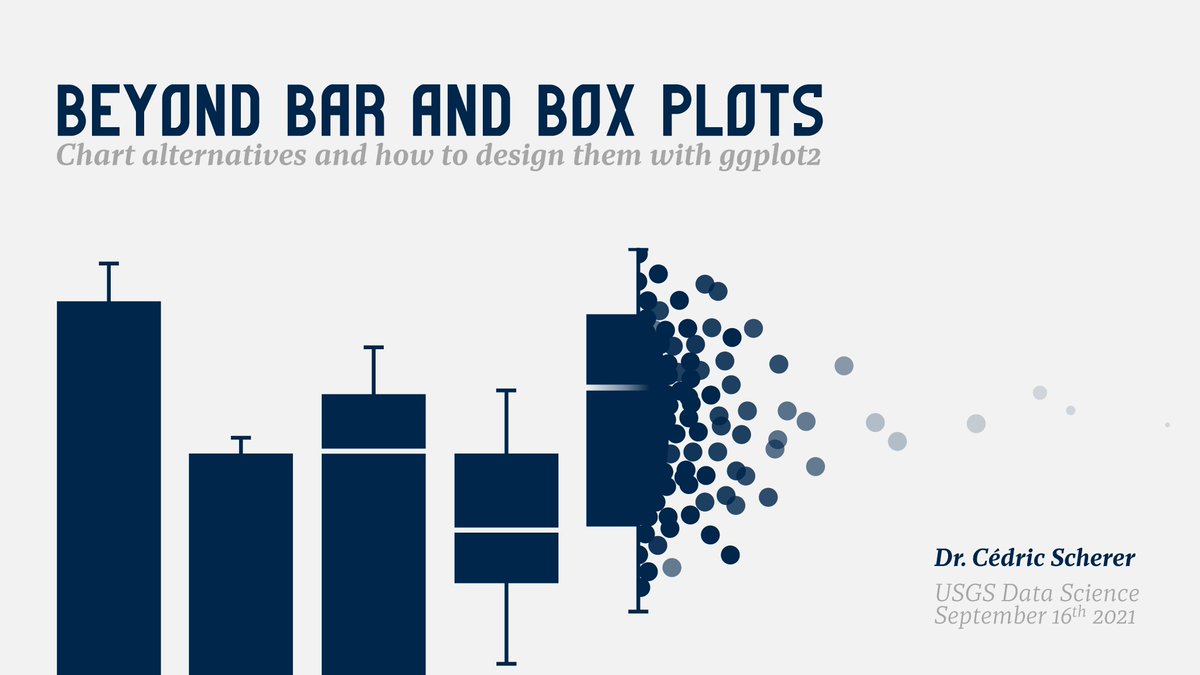
"Beyond Bar and Box Plots: Chart Alternatives and How to Design Them with #ggplot2" — talk at @USGS_CDI
"Visualizing Distributions with Raincloud Plots with #ggplot2" — blog post
"Effective #DataViz: How to Design Impactful and Aesthetically Pleasing Charts." — Talk for @heurekalabs and @DukeU
#TidyTuesday repository with all #rstats #ggplot2 codes of my 70 contributions
github.com/z3tt/TidyTuesd…
Tutorials based on my #TidyTuesday contributions featured on the #Rstats graph gallery @R_Graph_Gallery

• • •

Missing some Tweet in this thread? You can try to force a refresh
 

Keep Current with Cédric Scherer

Cédric Scherer Profile picture

Stay in touch and get notified when new unrolls are available from this author!

Read all threads

This Thread may be Removed Anytime!

PDF

Twitter may remove this content at anytime! Save it as PDF for later use!

Try unrolling a thread yourself!

how to unroll video
  1. Follow @ThreadReaderApp to mention us!

  2. From a Twitter thread mention us with a keyword "unroll"
@threadreaderapp unroll

Practice here first or read more on our help page!

More from @CedScherer

Mar 14, 2023
As the #rstats course material is not public (yet?) or available as online training (yet?), I thought I am sharing some slides from the deck.

The course covers all steps of the #DataScience workflow as featured in @hadleywickham's fantastic #R4DS 📕 r4ds.had.co.nz/index.html The title slide of the workshop "Reproducible Data AnalThree avatars (customised versions of the lovely Open Peeps A chapter slide entitled "What is This Course About?&quA conceptional representation of the data science workflow:t
Let's start with session 1:
"Introduction to #rstats and #rstudio" ®️ The title slide for the first session of the "ReproduciA slide explaining what the R programming language is:  &quoA comparison of R and Rstudio, taken from ModernDive: R is tA screenshot of Rstudio with the default panes: Script (uppe
The fundamentals of R includes:

* values
* assignments and objects
* functions
* data types
* unknown values
* vectors
* factors
* packages
* tabular data
* data generation
* data import A colorful overview of how functions work: the function nameA function might return a value, which is printed on a new lA colorful representation of objects and assignments in R: tA colorful explanation of vectors that start with the vector
Read 16 tweets
Aug 17, 2022
"Graphic Design with #ggplot2" 👨‍💼👩‍💻🧑‍💻

Do you want to recap the 2-day workshop at #rstudioconf? Or do you feel sad you've missed it?

🔥 All course material incl. latest updates can be found on the workshop webpage—9 sessions, 760 slides, 314 ggplots!

👉 rstudio-conf-2022.github.io/ggplot2-graphi… A screenshot of the rstudio::conf(2022) workshop "GraphA screenshot of the title slide of that workshop.The motivational example illustrating the capability of ggpl
@rstudio The session pages contain not only the slides but
🔵 hands-on #rstats codes
🔵 recap notes
🔵 exercises incl.
🔵 prepared scripts, either as #quarto or #rmarkdown
🔵 step-by-step solutions

➕ all source codes on GitHub: A screenshot of a session page, showing the recap notes and A screenshot of the script to answer exercise 1 of the firstThe title slide of the solution slide deck for exercise 1 inThe raw code for one of the exercises.
Some exemplary #dataviz from the workshop, 💯 done in #rstats thanks to #ggplot2 A colorful boxplot with overlaid juitterstrips. Three differOne of the exercise graphics using sina plots and errorbars,A bar plot showing reported bike counts as sums per season aThe "Speed of Language" visualization using normal
Read 4 tweets
May 18, 2022
Guess I got a bit side-tracked while creating some (mostly bad) color palette examples for a #datviz training...

1. sequential
2. diverging
3. rainbow
4. qualitative (used for quantitative data) A world map of human popula...A world map of human popula...A world map of human popula...A world map of human popula...
All the colors (so far) 🧡🤎💙💚❤️💜💛 screenshot of my collection...
A bit of additional information:

* for quantitative data like this we usually want to use a sequential (map 1+2) or diverging (map 3+4) color palette A world map of human popula...A world map of human popula...A world map of human popula...A world map of human popula...
Read 7 tweets
Dec 2, 2020
🔥🔥 MAJOR UPDATE 🔥🔥

The extended "#ggplot2 Tutorial for Beautiful Plotting in #Rstats" is online 🥳

A ton of new examples such as adding annotations, playing with after_scale, new chart types, modifying legends, interactive #dataviz and many more!

🔗 cedricscherer.netlify.app/2019/08/05/a-g… ImageImageImageImage
The tutorial now contains 188 plots and is generated with ~3000 lines of code.
Added topics (1/5):
- several alternative ways to solve things
- short explanation of geoms and theme in the intro
- more on theme elements
- in general a bit more text + explanations
- highlighting difference `scale_x|y_continuous()` vs `coord_cartesian(x|ylim)`
Read 11 tweets
Aug 4, 2020
#TidyTuesday Week 2020/32 ⚡ European Electricity by @EU_Eurostat inspired by @JohnMuyskens, @karim_douieb & @robradburn

Still experimenting with geofacets 🌐 And still experimenting with moon charts 🌘🌒🌖 Not enough green on that chart though.

#r4ds #rstats #ggplot2 #dataviz A geofacet of Europe that s...
Wasn't sure if I like the grey or white version better.
#FridaysForFuture #ClimateCrisis #ClimateAction #ClimateChange Image
Code for this and many other #dataviz'es on my GitHub: github.com/Z3tt
Read 5 tweets

Did Thread Reader help you today?

Support us! We are indie developers!


This site is made by just two indie developers on a laptop doing marketing, support and development! Read more about the story.

Become a Premium Member ($3/month or $30/year) and get exclusive features!

Become Premium

Don't want to be a Premium member but still want to support us?

Make a small donation by buying us coffee ($5) or help with server cost ($10)

Donate via Paypal

Or Donate anonymously using crypto!

Ethereum

0xfe58350B80634f60Fa6Dc149a72b4DFbc17D341E copy

Bitcoin

3ATGMxNzCUFzxpMCHL5sWSt4DVtS8UqXpi copy

Thank you for your support!

Follow Us!

:(