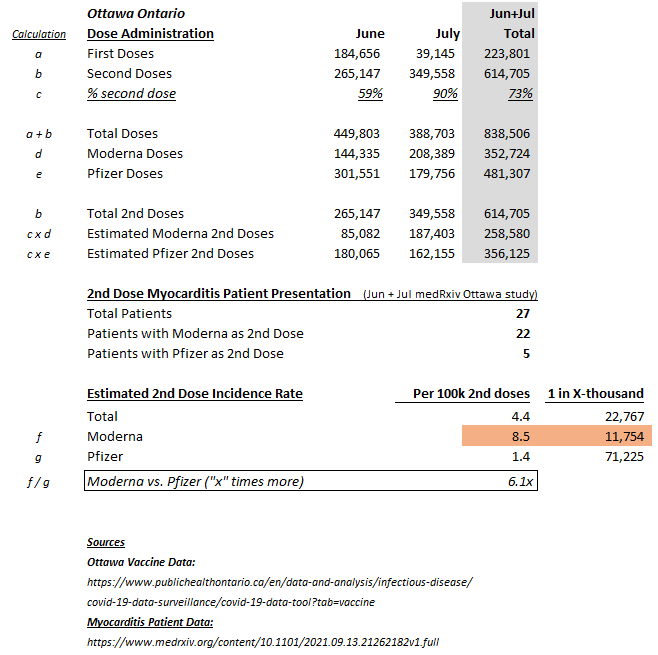
Correcting @HeartInstitute myo'itis study w/proper Ottawa vax data:

2nd Dose Myo Rate = 1 in ~22,750
BUT
Moderna = 1 in ~11,750
(6x > Pfizer at 1 in ~71,200)
⬆️not age stratified (higher in male & 18-24!)

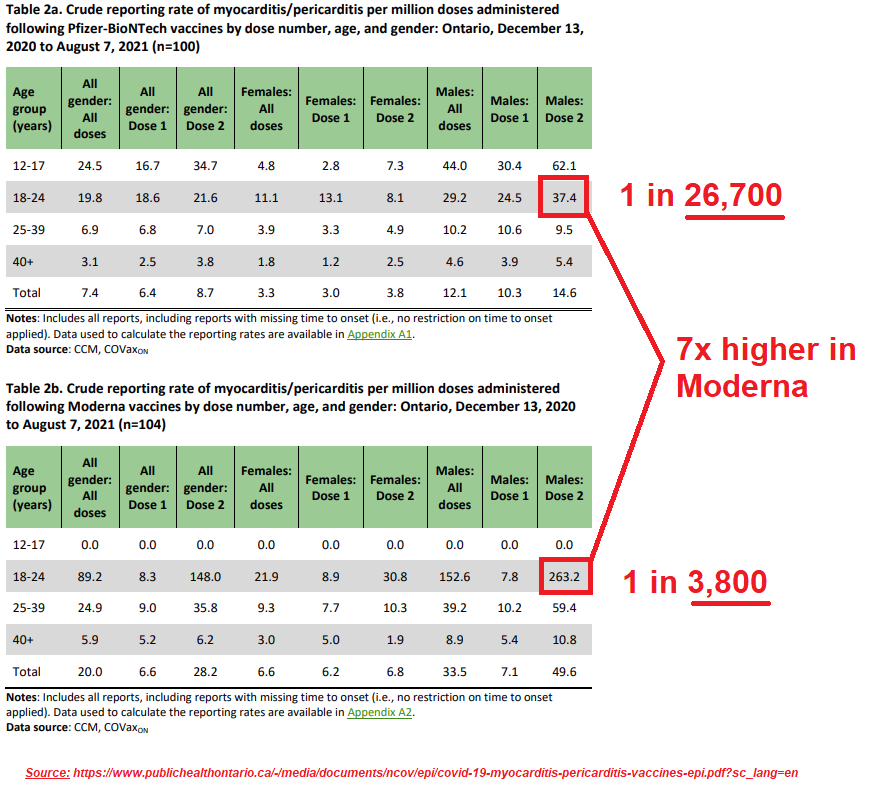
Consistent w @PublicHealthON!
2nd dose Moderna 1 in 3,800 18-24 male👇
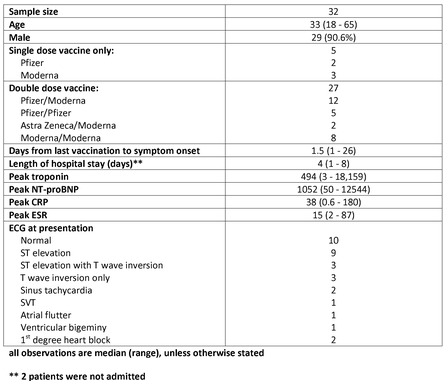
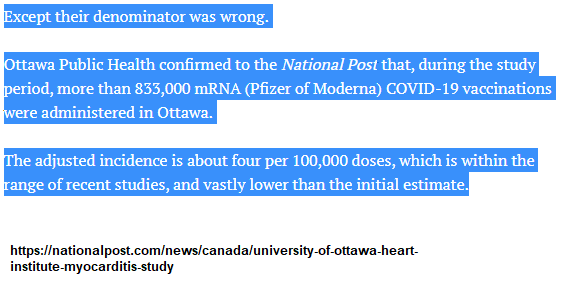
You can clearly see @sharon_kirky / @nationalpost likely did not review the detailed Ottawa dose data, usefully broken down by 1st/2nd doses & by Moderna/Pfizer. Simply stating aggregate ~830k doses vs. 32 myo cases (1 in 26,000) misinforms the public; the data is more nuanced !!
While @HeartInstitute made a big error in its denominator calculation, @sharon_kirky and @nationalpost do not appreciate that the aggregate data (32 cases and 830,000 doses) needs to be broken down in to 1st/2nd dose, Pfizer/Moderna, and age stratified.

• • •

Missing some Tweet in this thread? You can try to force a refresh
 

Keep Current with Kelly Brown

Kelly Brown Profile picture

Stay in touch and get notified when new unrolls are available from this author!

Read all threads

This Thread may be Removed Anytime!

PDF

Twitter may remove this content at anytime! Save it as PDF for later use!

Try unrolling a thread yourself!

how to unroll video
  1. Follow @ThreadReaderApp to mention us!

  2. From a Twitter thread mention us with a keyword "unroll"
@threadreaderapp unroll

Practice here first or read more on our help page!

More from @rubiconcapital_

21 Aug
Toronto Ontario
Neighbourhood Vax Rates vs. Socio-Demographic Factors

- 1st doses consistent across city
- 2nd doses; different story

Ex. #1. Neighbourhoods with more non-Asian "visible minorities" have less 2nd dose take-up.

Vax passports disproportionately affect minorities!
#2. Neighbourhoods with more services industry workers (foodservice/accommodation/retail/other services) also have less 2nd dose take-up.

Quite counter-intuitive!

Why would @epdevilla think that employer vax-mandates would be welcomed ??
#3. Looking deeper, calculating a 2nd dose “take-up rate” (2nd doses divided by 1st doses) for each neighbourhood we see that neighbourhoods with a HIGHER proportion of non-Asian visible minorities are strongly correlated with LOWER 2nd dose take-up rates.
Read 6 tweets
18 Aug
1/ Dr. Kieran Moore, please clarify:

According to Ontario data, for those 50+, unvax’d cases, partially vax’d cases and breakthrough cases *all have ~THE SAME hospitalization/death rates*

This seems inconsistent with the notion that breakthrough cases have less severe outcomes.
2/ Dr. Kieran Moore, please clarify:

While unvax'd cases/hosps/deaths appear more prevalent (both total & per 100k), Ontario doesn’t publish *testing data* or *testing protocol* by vax'd/unvax'd.

Its unknown if C19 surveillance protocol is affecting case/hosp/death prevalence!
3/ Dr. Kieran Moore, please clarify:

Example: in the last 6 wks, 50+ unvax'd case hospitalization rates have *more than doubled* vs. the consistent ~12% for the whole pandemic.

Could the sudden jump from 12% to 27% be due to relatively more hospital testing of unvax'd patients?
Read 5 tweets
28 Jun
1/ Grab some coffee

The “3rd wave” of C19 was LESS DEADLY than the “2nd wave”..

In-hospital fatality rates for Toronto patients:
2nd wave: 27%
3rd wave: 14%

The 3rd wave produced ~the same # of hospitalizations as the 2nd wave (~4,000), but just ~HALF the deaths (602 vs 1,054)
2/

The stark wave-to-wave in-hospital fatality rate differences is most pronounced when assessing only NON-INTUBATED patients (90% of all hospitalizations, ICU+ward):

2nd wave: 23%
3rd wave: 11%

(less than HALF!)
3/

Looking at the data another way, for NON-INTUBATED patients, the daily # of admissions in the 3rd wave was 55% HIGHER than the 2nd wave, yet the daily fatalities was 28% LOWER… (see bottom two charts)
Read 12 tweets
27 Apr
This past weekend, @DonaldWelsh16 was targeted by his local community newspaper for expressing on Twitter his anxieties about the actions and tendencies of our public health advisors. Donald is a concerned citizen, and was undeserving of a smear. 🧵
lfpress.com/news/local-new…
The newspaper zeroed in on Donald recalling the early origins of the holocaust. That is of course a sensitive point of comparison (extremely mildly put) and he has since apologized and deleted the tweets in question. Here is his follow-up thread:
Apart from this parallel, the @LFPRess appears to have had no interest Donald’s message. Donald is, quite simply, a concerned citizen (& experienced scientist), who like so many see a devolution & regression in public health’s abandonment of western procedures for something else.
Read 12 tweets
7 Apr
1/ IMPORTANT ICU DATA UPDATE
*This is not a tangential issue*
It directly impacts ICU narrative:

CCSO (live ICU) vs. CCM (gov’t patient database) continue to *DIVERGE MATERIALLY*
CCSO vs. CCM differ 3-fold!

@CriticalCareON & @publicHealthON must clarify:
2/ IMPORTANT ICU DATA UPDATE

CCSO daily new C-19 admissions are now almost FORTY-FIVE PERCENT (~45%) of new C-19 hospitalizations

A rising trend since Feb 1st, up from a range in the mid-20%s thru the winter wave

And 3X higher than CCM data (still in a consistent 10-20% band).
3/ IMPORTANT ICU DATA UPDATE

Note that for the entire pandemic, the national average of ICU admissions to total hospitalizations has been ~17.5%, according to PHAC weekly updates.

45% of new hospital admits being ICU admits is a massive statistical divergence!
Read 8 tweets
30 Mar
A cherry-picked stat is creating a media frenzy.

- A 50% ⬆️ in % of ICU admits in "younger people" vs. Dec is driven MOSTLY by admits in the 50-59 cohort!

- Yes, some ⬆️ in # of 49&U admits. BUT, the Ontario Science Table should know:

TWO data points DO NOT make a trend👇
2/

The data in the Toronto Database (as of Mar 22) are abundantly clear:

There were just FIVE (5) Toronto residents 49 & Under in ICU (1 39 & U), down from 12 as of Dec 21/’20

The next weekly Toronto database update is tomorrow, and I will update if there is a material change.
3a/

Related: an Important data note/inquiry for CCSO (@criticalcareON) & @PublicHealthON:

There appears wide divergence in ICU admits between (i) PubHealth Ontario’s Case & Contact Management (CCM) database and (ii) the CCSO data. (The Toronto data cited above is from the CCM).
Read 7 tweets

Did Thread Reader help you today?

Support us! We are indie developers!


This site is made by just two indie developers on a laptop doing marketing, support and development! Read more about the story.

Become a Premium Member ($3/month or $30/year) and get exclusive features!

Become Premium

Too expensive? Make a small donation by buying us coffee ($5) or help with server cost ($10)

Donate via Paypal Become our Patreon

Thank you for your support!

Follow Us on Twitter!

:(