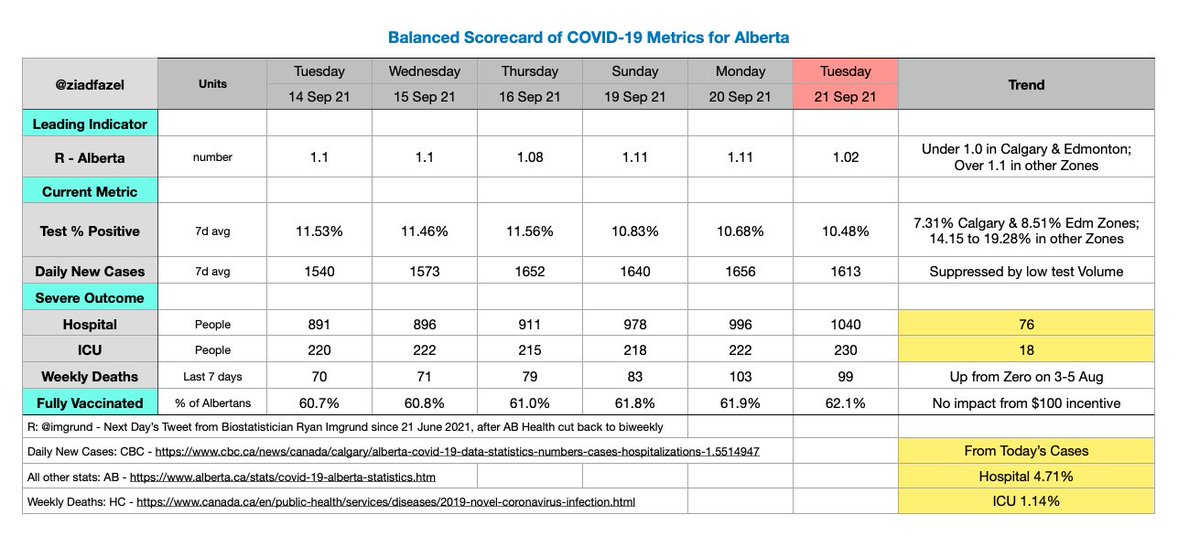
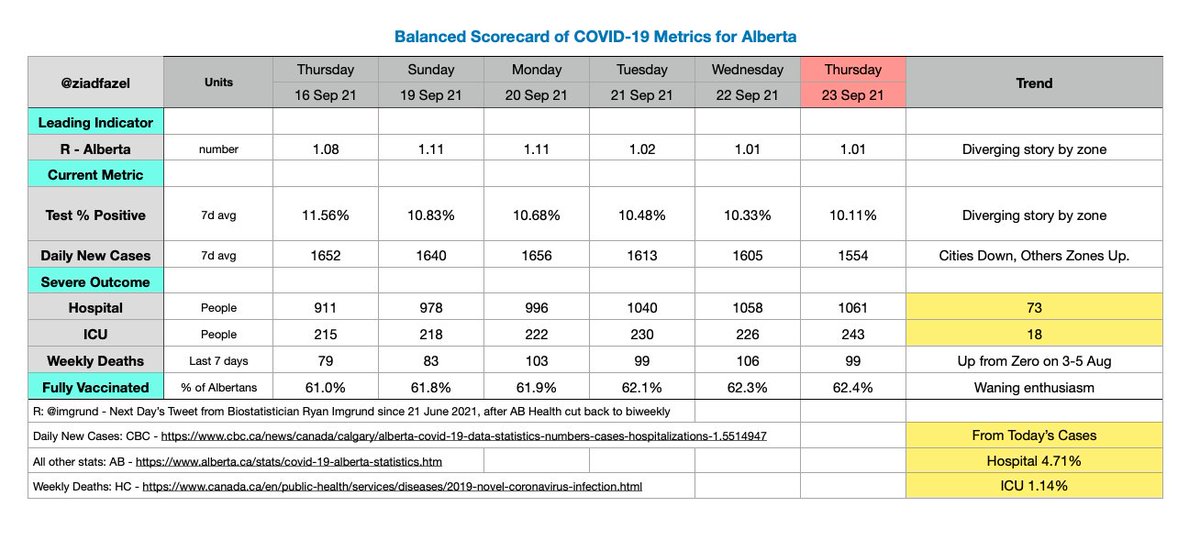
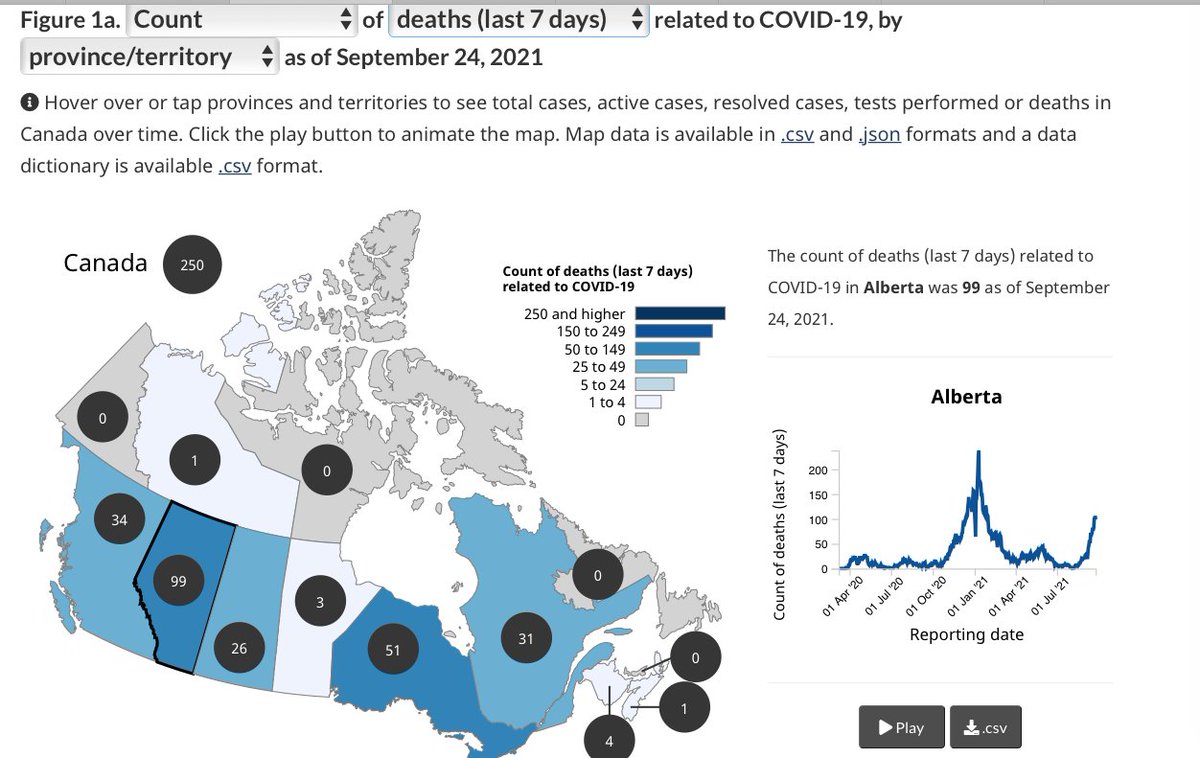
#COVID19AB Balanced Scorecard
Stats reported Fri 24 Sep
This weekend feels like seeing a Cat 5 hurricane bearing down on a remote island on Fri evening, knowing we won't hear for some days until power & telecom are back, praying for few deaths & devastation when they're out.
Stats reported Fri 24 Sep
This weekend feels like seeing a Cat 5 hurricane bearing down on a remote island on Fri evening, knowing we won't hear for some days until power & telecom are back, praying for few deaths & devastation when they're out.

Except we're not a remote island in open ocean. We're in Alberta, supposedly a modern society.
The hurricane has not passed. We've just had outer bands pass through. Rain, wind, storm surge, etc.
The 250 km/h eyewall is still coming. Major casualties. Hail & Devastation.
The hurricane has not passed. We've just had outer bands pass through. Rain, wind, storm surge, etc.
The 250 km/h eyewall is still coming. Major casualties. Hail & Devastation.

Modern society? Let's compare AB to City of Chicago
Population:
AB 4.4m
Chi 2.7m City (9.6m Metro)
Daily Cases:
AB 1554
Chi 412
Test Pos:
AB 10.11%
Chi 2.9%
Hospital:
AB 1061
Chi 25
Avg Daily Deaths
AB 14.1
Chi 3.57
Fully Vax
AB 62.4%
Chi 57.4%
chicago.gov/city/en/sites/…
Population:
AB 4.4m
Chi 2.7m City (9.6m Metro)
Daily Cases:
AB 1554
Chi 412
Test Pos:
AB 10.11%
Chi 2.9%
Hospital:
AB 1061
Chi 25
Avg Daily Deaths
AB 14.1
Chi 3.57
Fully Vax
AB 62.4%
Chi 57.4%
chicago.gov/city/en/sites/…


Calgary Wastewater Sampling and R
See Virus levels jump from beginning of September?
• School started
What reversed them a week into September?
• Mask Mandates by City & School Boards
Why aren't they still going down?
• Momentum of active cases
covid-tracker.chi-csm.ca
See Virus levels jump from beginning of September?
• School started
What reversed them a week into September?
• Mask Mandates by City & School Boards
Why aren't they still going down?
• Momentum of active cases
covid-tracker.chi-csm.ca


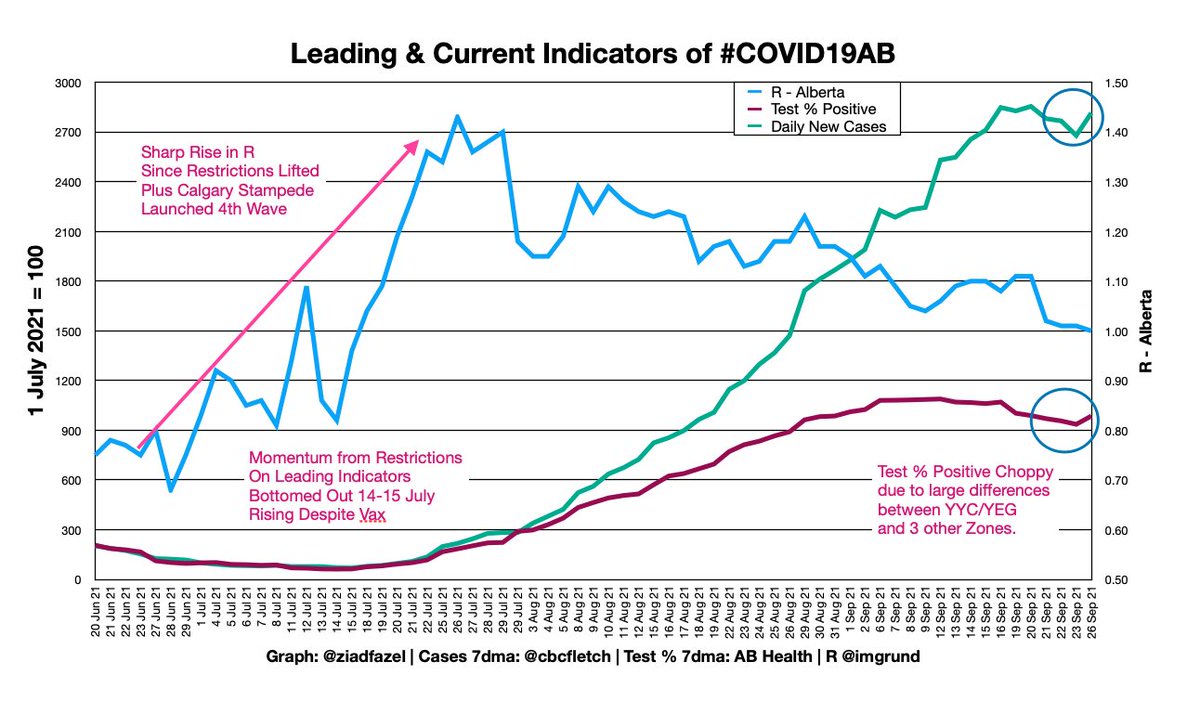
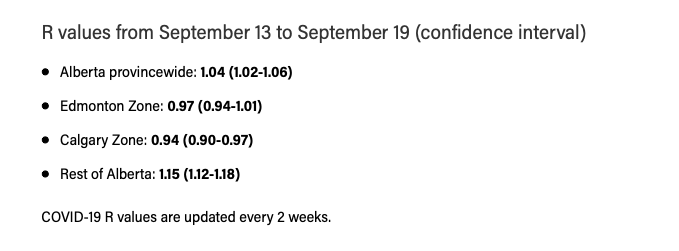
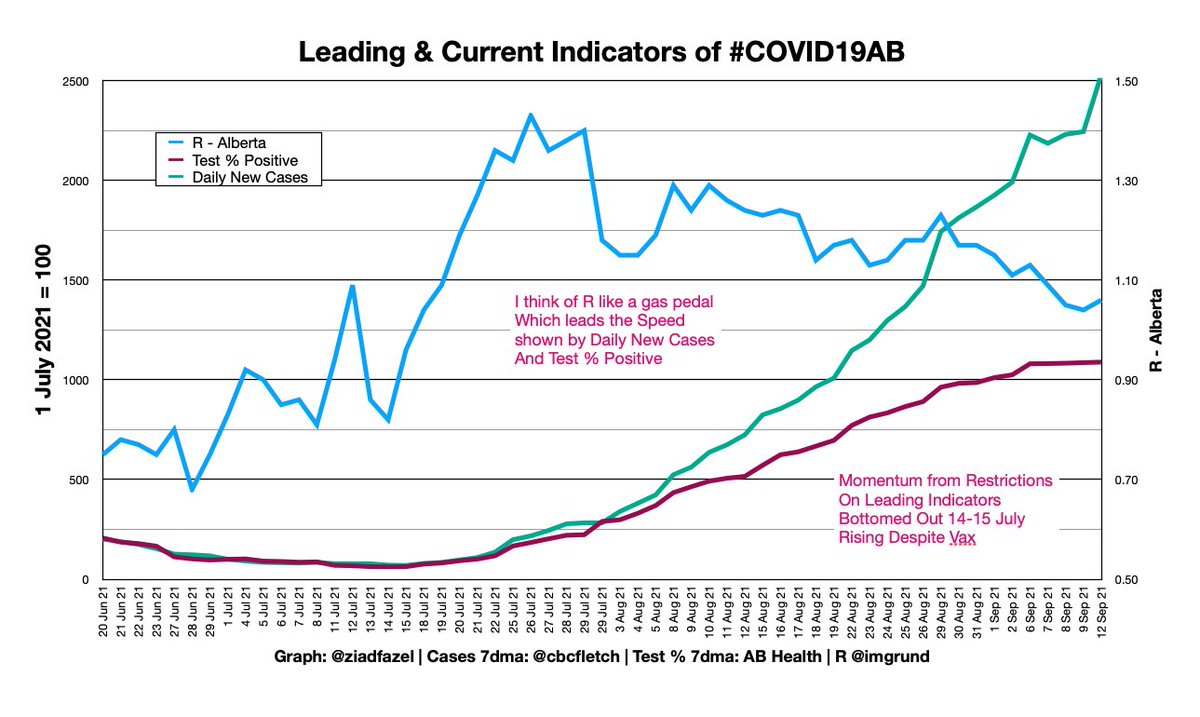
Alberta R
@Mrhockey1231 and I just finished upgrading these graphs.
• North, Edmonton & Central Zones
• Central, Calgary & South Zones
So we can see the city mice, country mice, how central mice correlate to YYC or YEG, and City-Country divergence.
@Mrhockey1231 and I just finished upgrading these graphs.
• North, Edmonton & Central Zones
• Central, Calgary & South Zones
So we can see the city mice, country mice, how central mice correlate to YYC or YEG, and City-Country divergence.
https://twitter.com/Mrhockey1231/status/1442310764316950534?s=20
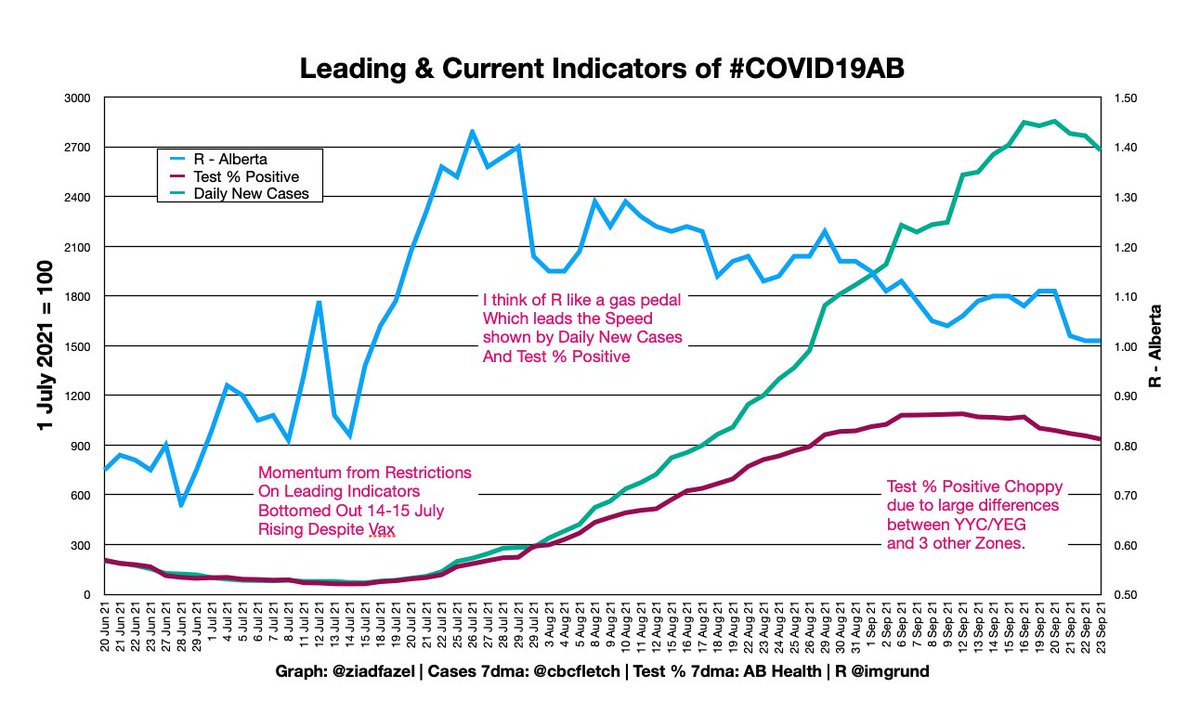
Test Positivity
There are really 2 Albertas hidden in my 1 Scorecard.
Overall, the province looks like the worst is over, because the heavily-populated Calgary & Edmonton Zones dominate the stats.
North, Central, South Zones. Big trouble. Choppy.
alberta.ca/stats/covid-19…
There are really 2 Albertas hidden in my 1 Scorecard.
Overall, the province looks like the worst is over, because the heavily-populated Calgary & Edmonton Zones dominate the stats.
North, Central, South Zones. Big trouble. Choppy.
alberta.ca/stats/covid-19…


Drat, lost the thread. Let's pick it up.
Above, Test Positivity, which is like 2 canoes on a roller coaster. Cities going down, Rural & Small Town going up.
This lost tweet is Active Cases by Geography & Vax.
Then I'll continue with Hospitalization.
Above, Test Positivity, which is like 2 canoes on a roller coaster. Cities going down, Rural & Small Town going up.
This lost tweet is Active Cases by Geography & Vax.
Then I'll continue with Hospitalization.
https://twitter.com/ZiadFazel/status/1442332644654542850?s=20
OK? Back to the main thread. Where was I?
Oh yes: R, test positivity and cases showing 2 Albertas. Cities going down, Zones going up.
Problem: we all need the same Hospitals. Whether we come from the upper 3 curves, or the lower 2 curves.
Shown with/without Alberta Avg.
Oh yes: R, test positivity and cases showing 2 Albertas. Cities going down, Zones going up.
Problem: we all need the same Hospitals. Whether we come from the upper 3 curves, or the lower 2 curves.
Shown with/without Alberta Avg.


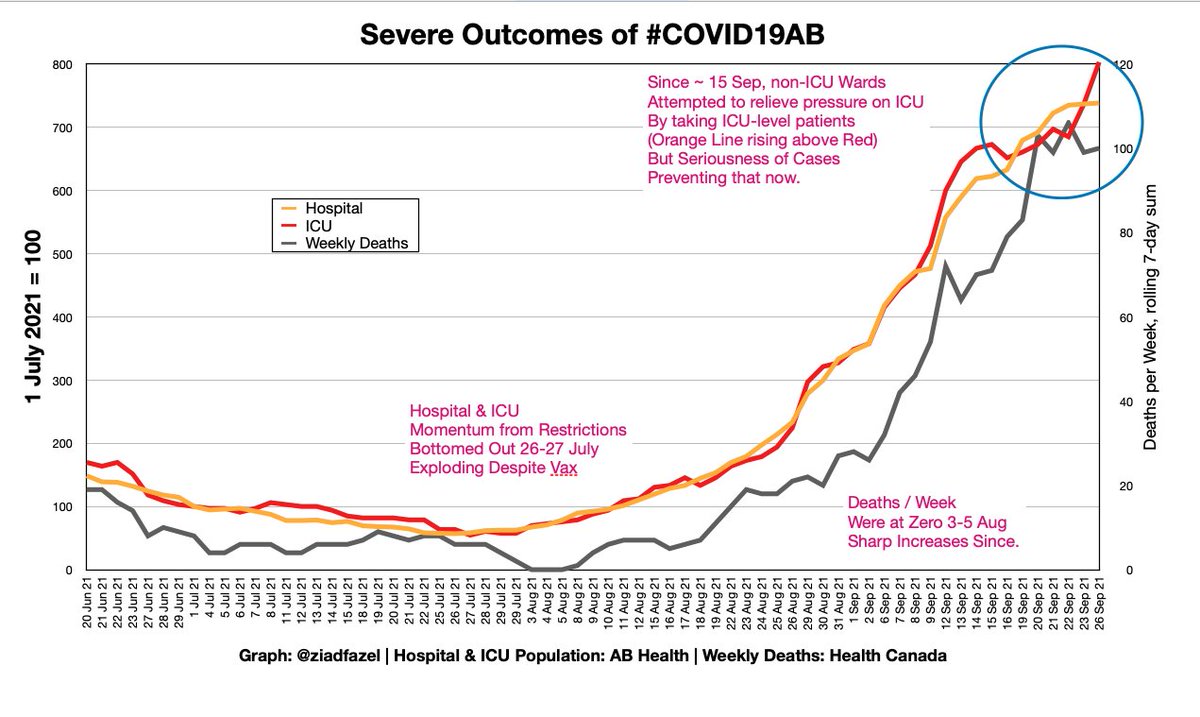
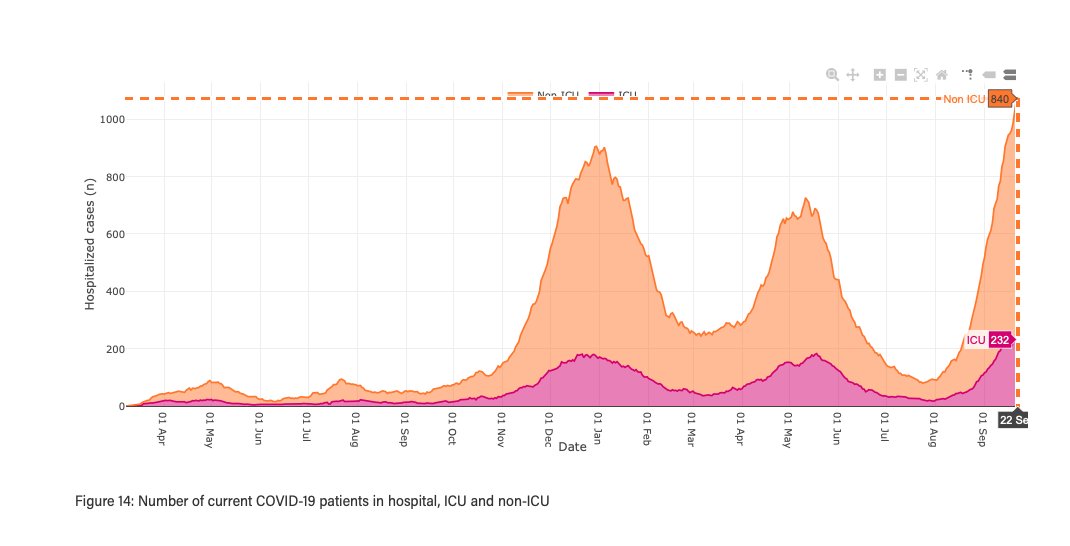
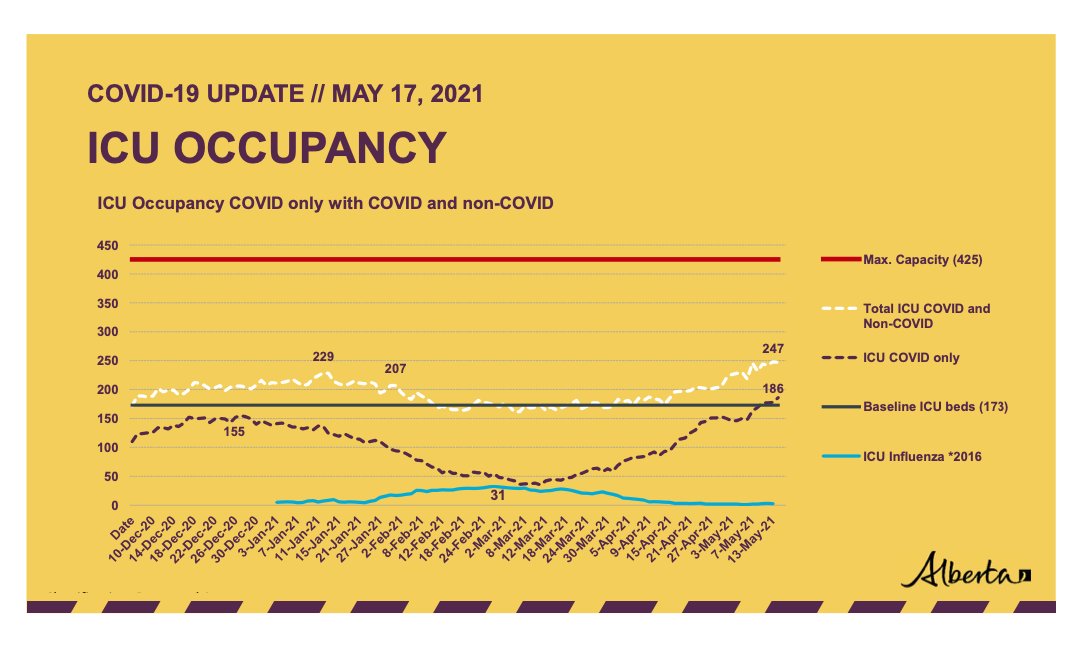
We have record Hospitalization, in every way:
• ICU
• ICU Surge Capacity
• non-ICU Wards like Internal Medicine taking COVID-level ICU patients to save lives
• transporting patients from one Zone to another to use every last bit of capacity
HCW breaking, to slow AB dying.
• ICU
• ICU Surge Capacity
• non-ICU Wards like Internal Medicine taking COVID-level ICU patients to save lives
• transporting patients from one Zone to another to use every last bit of capacity
HCW breaking, to slow AB dying.
Weeks ago, I was critical of Alberta Health showing Surge Capacity growing, thinking it was unachievable because you can't just clone record numbers of:
• Respiratory Therapists
• Critical Care Nurses
• ICU Docs
• Pharmacists
• Anaesthetists, etc.
like it's a video game.
• Respiratory Therapists
• Critical Care Nurses
• ICU Docs
• Pharmacists
• Anaesthetists, etc.
like it's a video game.


I'm one of the many voices saying you can't keep stressing healthcare workers to deal with this kind of workload.
But our CMOH, Health Minister du jour, and Premier keep doing it.
I work with many of these people in @PopAlberta. Under huge stress, they are innovating too.
But our CMOH, Health Minister du jour, and Premier keep doing it.
I work with many of these people in @PopAlberta. Under huge stress, they are innovating too.
@PopAlberta One innovation? Putting ICU-level COVID-19 patients in non-ICU Wards like internal medicine.
I relayed @NeejaB work with a team of devoted people, which is happening in every major hospital.
But cancelling surgeries doesn't magically clone ICU staff.
I relayed @NeejaB work with a team of devoted people, which is happening in every major hospital.
But cancelling surgeries doesn't magically clone ICU staff.
https://twitter.com/ZiadFazel/status/1440868464172756995?s=20


I'm an engineer/project manager with background in electronics manufacturing.
• New product introduction, starting from zero, to pilot, to ramp up. All the problems you face as you grow.
• Bringing on other plants to add capacity/enter new markets. The stress of transferring.
• New product introduction, starting from zero, to pilot, to ramp up. All the problems you face as you grow.
• Bringing on other plants to add capacity/enter new markets. The stress of transferring.
These amazing people are doing it all simultaneously:
• from 80 people on 24 July
• to 1061 on 24 September
• 13.3x in 2 months
• using multiple sites
• try raising capacity of any manufacturing or organization process that fast
Imagine rush hour traffic 13.3x in 2 months.
• from 80 people on 24 July
• to 1061 on 24 September
• 13.3x in 2 months
• using multiple sites
• try raising capacity of any manufacturing or organization process that fast
Imagine rush hour traffic 13.3x in 2 months.


These are human beings in our hospitals, not wireless telecom in a factory. They're about as fragile and perishable as a "product" can get.
And we're still not seeing how complex this picture.
Last week AHS CEO Dr Verna Yiu said deaths were making room for new admissions.
And we're still not seeing how complex this picture.
Last week AHS CEO Dr Verna Yiu said deaths were making room for new admissions.
At the same time, I was working with a skilled "data wrangler" in Edmonton, who uses Tableau to illustrate complex concepts simply.
@jkparker taught me how to show the daily admissions, average daily deaths, and running count of patients in ICU.
public.tableau.com/app/profile/jk…
@jkparker taught me how to show the daily admissions, average daily deaths, and running count of patients in ICU.
public.tableau.com/app/profile/jk…
So, looking at her Tableau, you can see:
• the running count at end of day understates the problem
• our Healthcare workers have to handle 50+ admissions PER DAY
• and absorb a rising AVERAGE of 11 deaths per day
• daily admissions fluctuate widely
• one day 53; next day 17
• the running count at end of day understates the problem
• our Healthcare workers have to handle 50+ admissions PER DAY
• and absorb a rising AVERAGE of 11 deaths per day
• daily admissions fluctuate widely
• one day 53; next day 17

Last Friday, you got to see me cry on YouTube.
This Friday I got to watch my dear new friends, who are doing laudable work to save lives in Alberta, artful innovation and brute force pushing themselves.
Some were crying. Some numb. Some stoic. Some ??.
This Friday I got to watch my dear new friends, who are doing laudable work to save lives in Alberta, artful innovation and brute force pushing themselves.
Some were crying. Some numb. Some stoic. Some ??.
You can't do this to people. It's grotesque & sadistic.
@jvipondmd calls this the #IntentionallyCruelWave
• Not just to people dying.
• HCW breaking to stop it
• Family & friends of people in Hospital
• People whose surgeries were cancelled AGAIN to make room for COVID-19
@jvipondmd calls this the #IntentionallyCruelWave
• Not just to people dying.
• HCW breaking to stop it
• Family & friends of people in Hospital
• People whose surgeries were cancelled AGAIN to make room for COVID-19


@jvipondmd Kids age 5-11:
• started school in Sep
• too young to be vaccinated
• rooms with inadequate ventilation or filtration
• inadequate masks, if at all
Look how "Best Summer Ever" changed once school started.
Every other age now 📉
Vulnerable kids 📈
alberta.ca/stats/covid-19…
• started school in Sep
• too young to be vaccinated
• rooms with inadequate ventilation or filtration
• inadequate masks, if at all
Look how "Best Summer Ever" changed once school started.
Every other age now 📉
Vulnerable kids 📈
alberta.ca/stats/covid-19…


I didn't get to work with @jkparker on this amazing collection of Outbreaks in K-12 Schools.
@SOSAlberta has to do this, because GoA is not doing contact tracing in schools.
Volunteers & parents doing what AB Health & AB Education should be doing.
public.tableau.com/app/profile/jk…
@SOSAlberta has to do this, because GoA is not doing contact tracing in schools.
Volunteers & parents doing what AB Health & AB Education should be doing.
public.tableau.com/app/profile/jk…
I have been procrastinating this all weekend.
These aren't just lines on a graph. They're people, with families.
But we can't ignore the Deaths happening in our province.
See that jump to steeper rate of death at end August? You can see it better compared to a straight line.
These aren't just lines on a graph. They're people, with families.
But we can't ignore the Deaths happening in our province.
See that jump to steeper rate of death at end August? You can see it better compared to a straight line.


We know, that wave after wave, around world, when you change public health measure, there is a cadence:
• leading indicators change in ~2 wks
• Hospitalization in ~3-4 wks
• Deaths in ~4 wks
So what happened at end July for Deaths to📈~4 wks later?
👉alberta.ca/release.cfm?xI…
• leading indicators change in ~2 wks
• Hospitalization in ~3-4 wks
• Deaths in ~4 wks
So what happened at end July for Deaths to📈~4 wks later?
👉alberta.ca/release.cfm?xI…


@jvipondmd @GosiaGasperoPhD @RajBhardwajMD @TehseenLadha @drdagly @Rea_Booker @kwburak @plasercalgary @NeejaB @PfParks That's all for me this weekend.
Tomorrow, we'll have new ICU stats from AHS.
albertahealthservices.ca/br/Page17593.a…
We should get an update from AB Health.
We'll see the damage from the hurricane @PopAlberta and every HCW in Alberta were fighting.
But that hurricane is still coming in.
Tomorrow, we'll have new ICU stats from AHS.
albertahealthservices.ca/br/Page17593.a…
We should get an update from AB Health.
We'll see the damage from the hurricane @PopAlberta and every HCW in Alberta were fighting.
But that hurricane is still coming in.

• • •
Missing some Tweet in this thread? You can try to
force a refresh