Sum

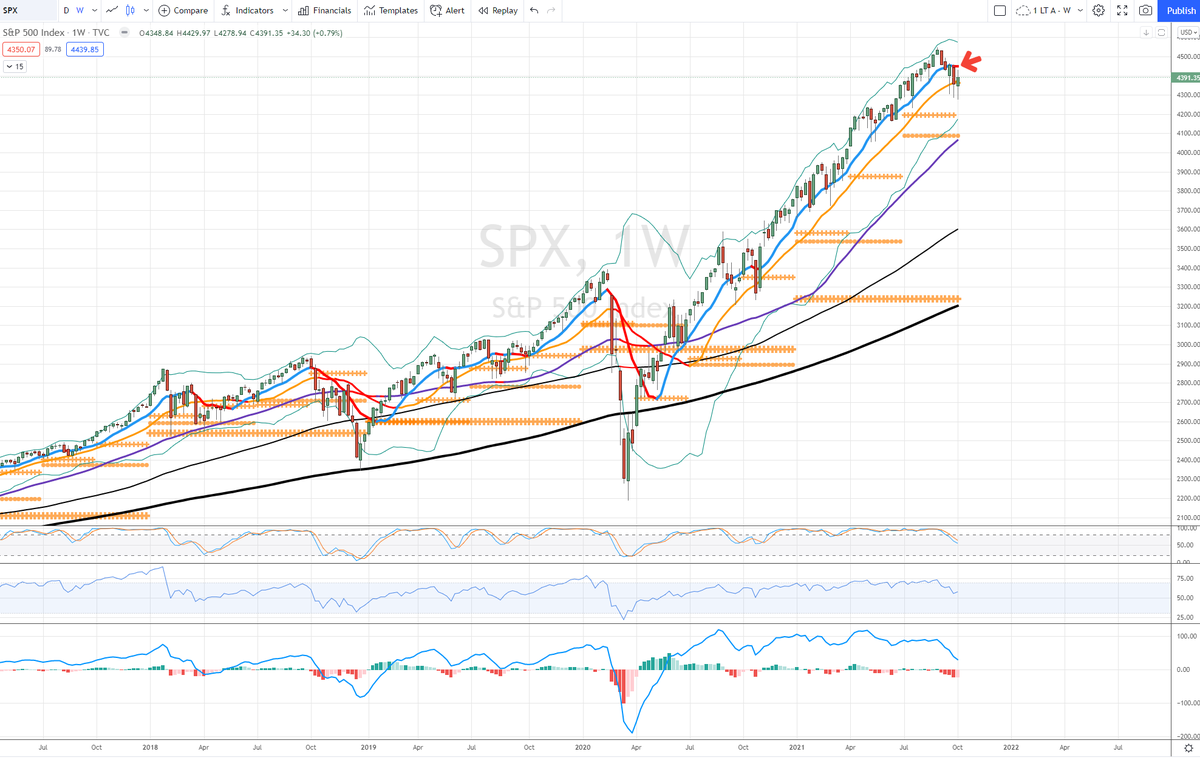
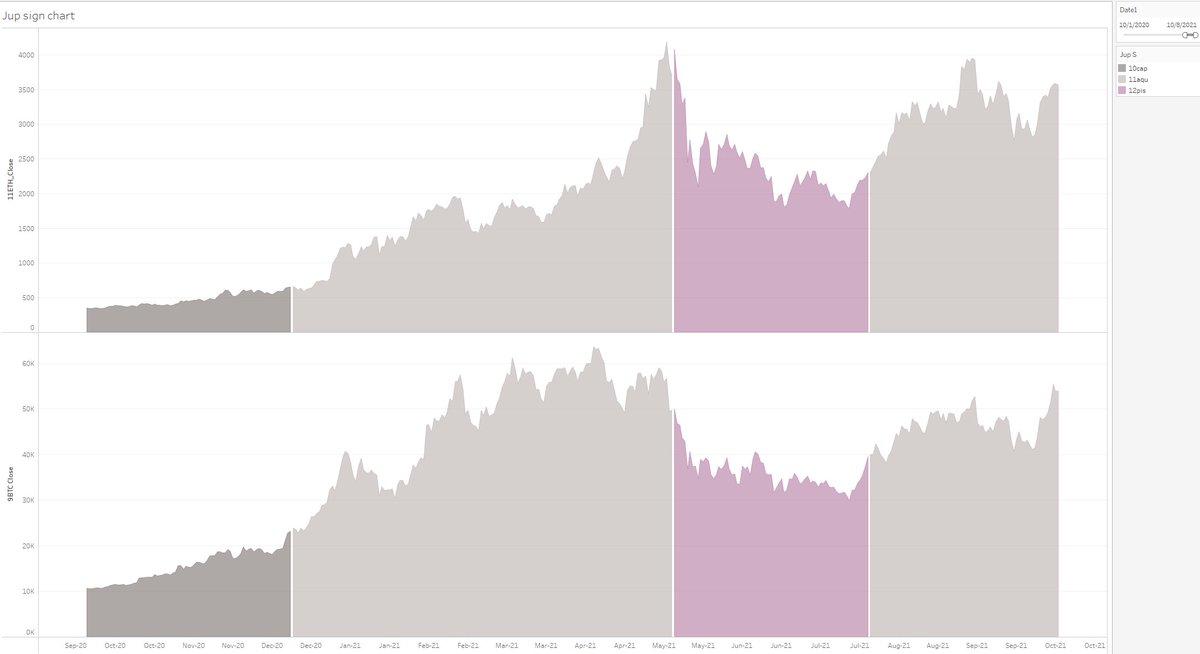
Q4 has started very healthy for cryptos and after 10/1-4 low on main indexes they have gotten in gear as well

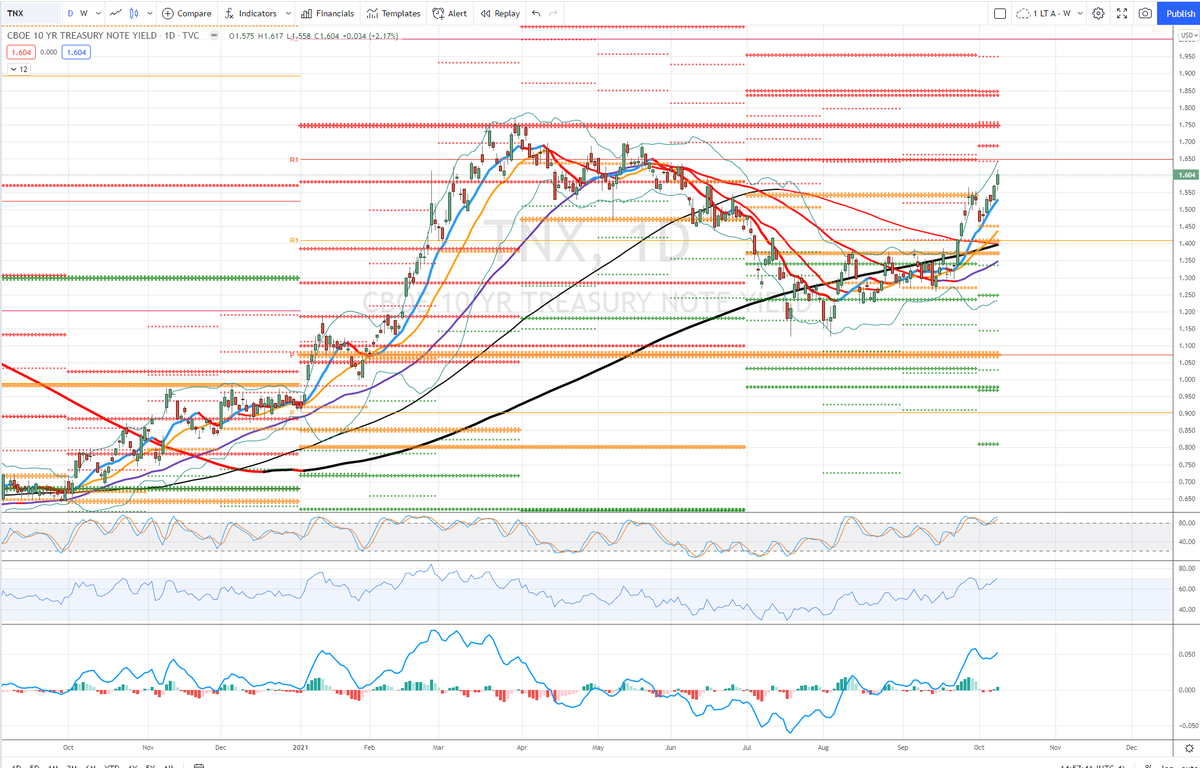
Safe havens VIX GLD TLT all weak, only DXY about sideways in Q4 so far

Possible that recent configurations (Sun cnj Mars) drove safe havens down & boosted risk...
But buyers came in & with astro for week ahead expect risk-on to continue

Next holiday might be Halloween, but with Sun Mars Merc in Libra & Venus in Sag, this is what people are feeling...

& they ain't buying gold
Buying cryptos, stocks in general, especially inflation related themes, & institutions might be selling into tech rallies sensing higher yields ahead

docs.google.com/spreadsheets/d…

Good luck,
ciao
~Marsilio~
Click into current Forecast Tab for summary

unroll @threadreaderapp

• • •

Missing some Tweet in this thread? You can try to force a refresh
 

Keep Current with Marsilio's Market Musings

Marsilio's Market Musings Profile picture

Stay in touch and get notified when new unrolls are available from this author!

Read all threads

This Thread may be Removed Anytime!

PDF

Twitter may remove this content at anytime! Save it as PDF for later use!

Try unrolling a thread yourself!

how to unroll video
  1. Follow @ThreadReaderApp to mention us!

  2. From a Twitter thread mention us with a keyword "unroll"
@threadreaderapp unroll

Practice here first or read more on our help page!

More from @MarsiliosMM

10 Oct
Index TA

A lot of technical bullish action last week

DJI from below Q4P & OctP to above all - dealing with falling 50MA though

SPX same

RUT held 2HP & D200MA, above all pivots

NDX laggard actually, still below Q4P & OctP

Confirmed by VIX VXX SVXY, usually works

But...
Weekly charts show mostly sideways since July on DJI SPX NDX and 10MAs (arrows) have rolled over negative

Will the current +s be enough for indexes to test highs again? Perhaps, I think so...

But there are some levels to watch, daily 50MAs, near these weekly 10MAs
Main risk to stocks might just be yields up

Also this would hurt tech the most

TNX on the move after recently holding D200, 2HP, above all pivots, all daily MAs + slope

Weekly chart looks different & Sun cnj Mars was driving recent push but if yields keep going maybe trouble
Read 4 tweets
10 Oct
Astro

I assume fluency with position, motion and rulership (traditional only), and use the terms a lot - if you don't know these check the Astro Glossary in the google sheet

docs.google.com/spreadsheets/d…
If you don't care about the "why" just skip this section entirely

Pluto
Recently direct in Cap-Sat, should be more nasty but data studies didn't have a huge edge on Pluto Dir Rx status

Neptune no change, Rx Pisces-Mars
Uranus no change, Rx Taurus-Merc
Saturn
Stationing direct

1945-2021
SPX avg daily %
Saturn sign & motion

Amazing results here

Signs Saturn doesn't like
Aries, Cancer, Leo
Direct worse, Rx better

Signs Saturn likes
Libra, Cap, Aqu
Direct better, Rx worse
Read 15 tweets
10 Oct
Now onto usual programming :)

Review

Astro - focusing on recent changes & a few interesting data studies

TA - selected charts

Sum

Will post the threadreader app after each

Read what sections interest you
From the sheet:
Indexes: "Prefer down to 10/10 area, but not high confidence - FXI / China most likely"

Not correct so far, but did call an audible and thought key low might be in per 10/6 close

Cryptos: "Looking more bullish, esp 10/5-7"

Nailed
Read 8 tweets
10 Oct
Before the regular routine, I'm going to share a few astro data studies on weekday for SPX

Realize most of you are crypto fans, and this is also for the astro fluent, but some of this pretty cool

Too many tweets to go through everything, so selection of notable charts ahead
All charts current rally environment 4/1/2020-10/1/2021

By weekday avg % return

1 = Monday
2 = Tues
3 = Weds
4 = Thurs
5 = Fri

I've also looked at more data and current pattern is not in play all the time - Mondays actually more negative, historically
For Mondays only, here are results split by Moon sign (9:30 ET)

Not sure why Sag & Pisces negative, but for the astro fluent there is a pattern

Keep in mind, very limited incidence:
1.5 years about = 18 months
4 Mondays a month, approx
72 Monday / 12 signs = ~6 each
Read 12 tweets
9 Oct
#Ethereum #Bitcoin #BTC #Cryptos

Unique view of planetary motion & price

ETH on top, BTC below, showing planets in tropical zodiac signs

Weekly visual update Saturdays
Detailed astro & markets Sundays

I combine technicals & timing to understand markets -

Thread >
Saturn

If not familiar with planet motions, see color legend to right - all colors show same signs throughout all charts

Since Saturn in Aquarius has been a huge supporter of cryptos, makes sense that the pending station isn't hitting hard or even up
Jupiter

Jupiter in Aquarius also supporting cryptos
Read 15 tweets
8 Oct
Today's job news pretty bad

"Fewest Jobs in 9 Months"

Consensus 500K, actual 194K

And economics is considered scientific while astro is voodoo

On indexes no economist can compare
And even on this jobs report I would beat them

But main point -
As I type SPX & NDX flat

Why?

Bad news = good news b/c FOMC QE

Now, it was dumb of me to not adopt this in March 2020 when FOMC came in massively, like beyond conception, pumping 1T in a few weeks with promise to continue whatever needed
How does this end? Still an open question.

If the worst astro = top of market, because market participates think QE no end in foreseeable future, then maybe still already in or close to in

early Sept was Jupiter Rx in term of Saturn, out of that term actually lower
Read 6 tweets

Did Thread Reader help you today?

Support us! We are indie developers!


This site is made by just two indie developers on a laptop doing marketing, support and development! Read more about the story.

Become a Premium Member ($3/month or $30/year) and get exclusive features!

Become Premium

Too expensive? Make a small donation by buying us coffee ($5) or help with server cost ($10)

Donate via Paypal Become our Patreon

Thank you for your support!

Follow Us on Twitter!

:(