#Ethereum #Bitcoin #BTC #Cryptos
Unique view of planetary motion & price
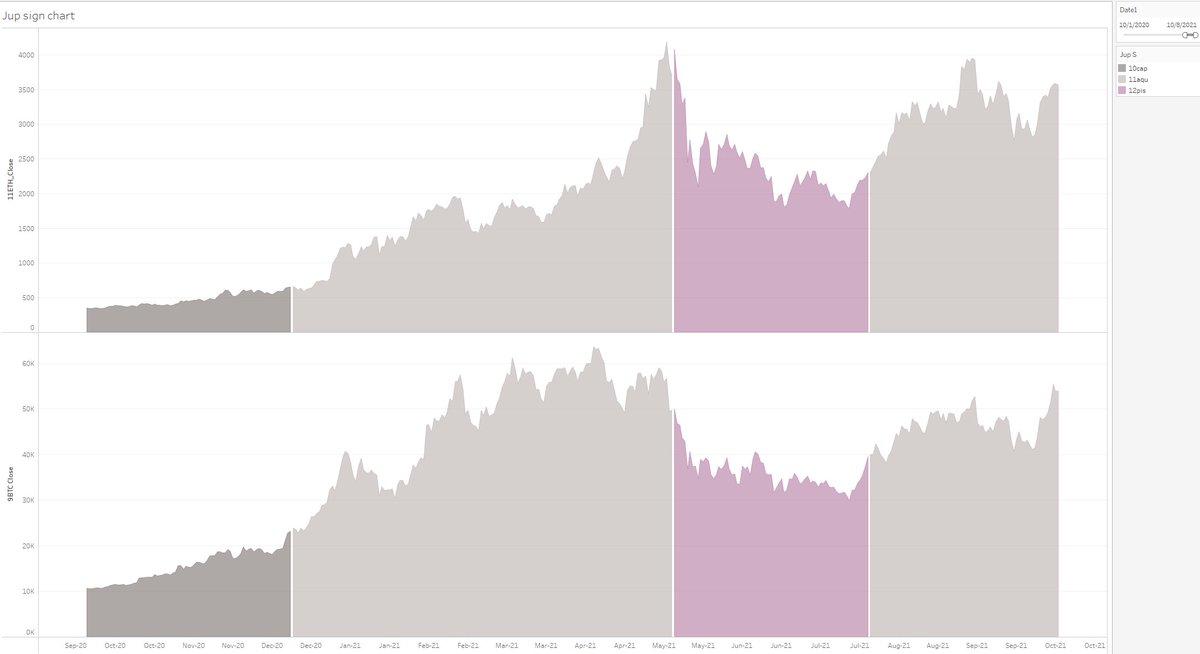
ETH on top, BTC below, showing planets in tropical zodiac signs
Weekly visual update Saturdays
Detailed astro & markets Sundays
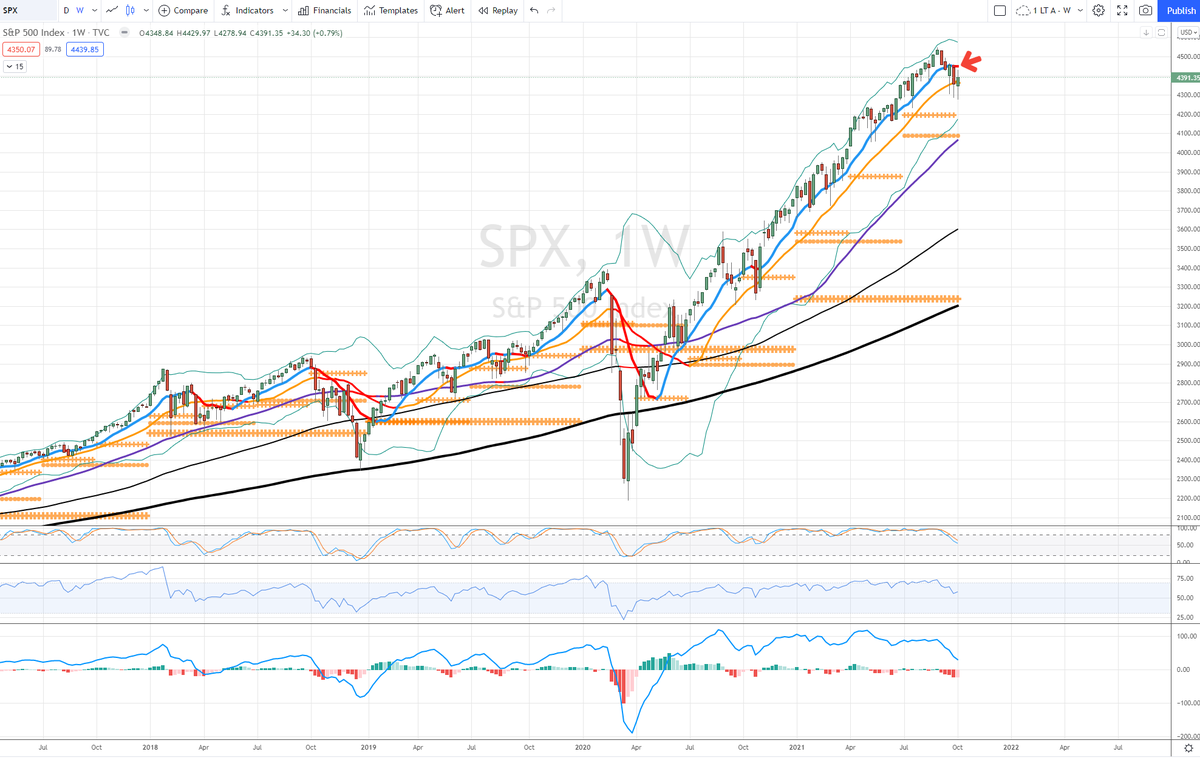
I combine technicals & timing to understand markets -
Thread >
Unique view of planetary motion & price
ETH on top, BTC below, showing planets in tropical zodiac signs
Weekly visual update Saturdays
Detailed astro & markets Sundays
I combine technicals & timing to understand markets -
Thread >
Saturn
If not familiar with planet motions, see color legend to right - all colors show same signs throughout all charts
Since Saturn in Aquarius has been a huge supporter of cryptos, makes sense that the pending station isn't hitting hard or even up
If not familiar with planet motions, see color legend to right - all colors show same signs throughout all charts
Since Saturn in Aquarius has been a huge supporter of cryptos, makes sense that the pending station isn't hitting hard or even up

Jupiter
Jupiter in Aquarius also supporting cryptos
Jupiter in Aquarius also supporting cryptos
Mars
Mars in Libra doing fine
Stock data in bull markets was good too
Know the theory, but need to investigate & verify
Mars in Libra doing fine
Stock data in bull markets was good too
Know the theory, but need to investigate & verify

North Node / NN / Rahu
North Node in Gemini has also been a large part of the crypto rally
But getting towards the end and one of a few major changes near year end
North Node in Gemini has also been a large part of the crypto rally
But getting towards the end and one of a few major changes near year end

Sun
Sun in Libra doing well also
Sun in Libra doing well also

Venus
Prices are updated through the 10/8 close
So Venus in Sag has just begun
Prices are updated through the 10/8 close
So Venus in Sag has just begun

Mercury
Mercury by sign - so easy to see staying longer in Aquarius, Gemini & Libra
If you know your astro basics, the Rx periods all Air this year
Mercury by sign - so easy to see staying longer in Aquarius, Gemini & Libra
If you know your astro basics, the Rx periods all Air this year

Mercury
Mercury by motion, with Rx in orange
That's funny, another vertical move during MercRx
Mercury by motion, with Rx in orange
That's funny, another vertical move during MercRx

Moon
Different data - BTC avg 15m % return
2020-current
By Moon quarter
Q4 huge win last week but they aren't all like that
Different data - BTC avg 15m % return
2020-current
By Moon quarter
Q4 huge win last week but they aren't all like that

Moon Q
Mostly 1 bar 1 Quarter, with occasional split into 2 bars at month end
Q4 almost no downside nearly 1.75 years amazing
Mostly 1 bar 1 Quarter, with occasional split into 2 bars at month end
Q4 almost no downside nearly 1.75 years amazing

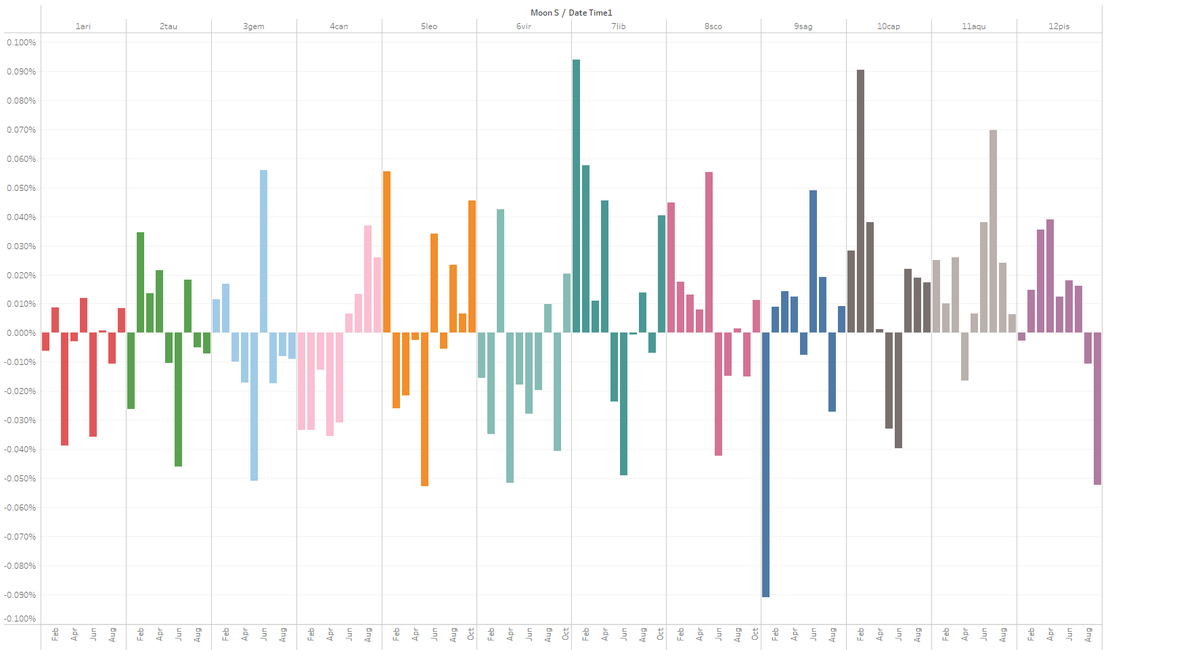
Moon Sign
2020-current
Aries & Virgo weak links
Sag middling
Cap & Aqu power zone
2020-current
Aries & Virgo weak links
Sag middling
Cap & Aqu power zone

Moon Signs
2021 only
1 bar 1 pass, mostly
Sag 3 negative results but 1 was a whammy, so that dragged down the average
Why Cancer terrible then better? Pluto motion? Not sure. These do change per condition of sign & ruler, and market environment.
2021 only
1 bar 1 pass, mostly
Sag 3 negative results but 1 was a whammy, so that dragged down the average
Why Cancer terrible then better? Pluto motion? Not sure. These do change per condition of sign & ruler, and market environment.
Moon Terms
BTC 2020-current
Just a teaser, there is a lot more to this
But fact is, terms of Mercury best & Saturn worst, by far, stretching over 1.75 years
BTC 2020-current
Just a teaser, there is a lot more to this
But fact is, terms of Mercury best & Saturn worst, by far, stretching over 1.75 years

unroll @threadreaderapp
• • •
Missing some Tweet in this thread? You can try to
force a refresh