I'm not in the business of picking tops and bottoms. I will never short an index like this.

However, I'm in the business of identifying extremes relative to past price actions.

#INDIA benchmarks are taking a parabolic shape with consecutive gap openings. #SENSEX #NIFTY
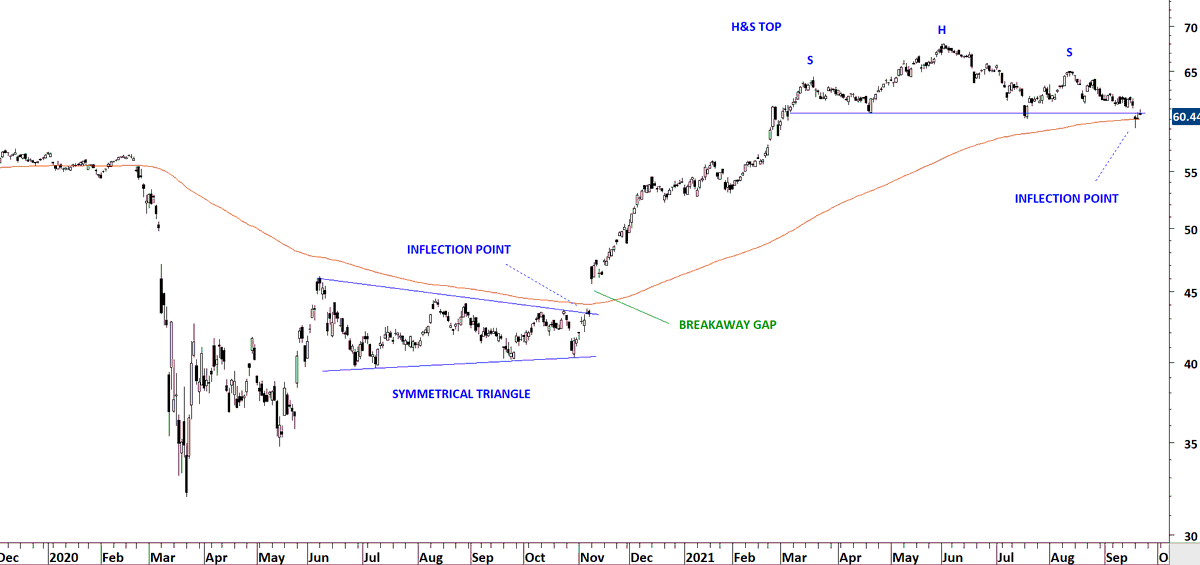
Question I'm trying to answer, what are those gaps at all-time highs???

From Richard Schabacker:
I think we can narrow it down to continuation & exhaustion gaps.
More on exhaustion and continuation gaps.

• • •

Missing some Tweet in this thread? You can try to force a refresh
 

Keep Current with Aksel Kibar, CMT

Aksel Kibar, CMT Profile picture

Stay in touch and get notified when new unrolls are available from this author!

Read all threads

This Thread may be Removed Anytime!

PDF

Twitter may remove this content at anytime! Save it as PDF for later use!

Try unrolling a thread yourself!

how to unroll video
  1. Follow @ThreadReaderApp to mention us!

  2. From a Twitter thread mention us with a keyword "unroll"
@threadreaderapp unroll

Practice here first or read more on our help page!

More from @TechCharts

15 Oct
It is ok to wait for confirmation. It is ok not to predict but get more info. from the chart itself and act.

This was when I concluded the breakout is valid and symmetrical triangle is completed. $BTC

Chart patterns are confirmed when they are mature. It is usually difficult to understand at what level the pattern is mature. For me this is with several tests of pattern boundary.

First reversal signal on $BTC was covered with this setup.

Rising wedge breakdown was followed by a rebound which formed the right shoulder of a H&S top. The correction towards 30K was covered with this chart pattern setup.

Let the market give clues to the direction of the trend. We don't want to predict.

Read 4 tweets
14 Oct
This is considered Type 2 breakout. (Explained in following videos).

Irrespective of time frame (note I don't analyze intraday price action), price dynamics are the same. Breakouts can be followed by pullbacks and those would ideally find support at the previous resistance.
Piyasada birileri..., dis gucler, soros, vs. gibi inanclari olan arkadaslar icin Isvec borsasinda islem goren bir hissenin grafigini paylasiyorum.

Piyasadaki o "birileri" ne atfedilen hareketler aslinda kolletif olarak toplu suru piskolojisi/insan davranislarindan kaynaklaniyor
Reference to earlier tweet on the price dynamics of a Type 2 breakout.
Read 4 tweets
3 Oct
Are you ready for a visual exercise?
Qualities we will be looking for:

1) A clean horizontal boundary

2) Min 3 tests of the pattern boundary

3) If a short trade = needs to be below 200-day
If a long trade = needs to be above 200-day
Find 3 text-book trades / chart pattern setups

This is a weekly scale price chart and the moving average is 40 week period (200-day)

Answers format:
Pattern name/completed year
Read 6 tweets
3 Oct
Define a research universe 500, 1000 names... depends on your time dedicated for market research each day & weekend.

Make sure you go through the same list every single day.

What you miss earlier you might capture later.

You see the development of price charts better
Open each chart with the same template. Don't go into style drift by saying: Hmm.. let me see what X indicator is doing or let me go into hourly chart etc.

You have 1hr (or how much it takes to finish the list you have built) to finish the work and move off the screen.
Before you finalize, see if any pattern fit your criteria. Save those to a separate folder and review them the next day first thing after the market close. That's your watchlist.
Read 5 tweets
3 Oct
Weekends are dedicated for the review of weekly scale price charts.
After the close of each trading day, review the end of day charts.

After the close of each trading week, review the end of week charts.

Repeat this for a month and you will develop a routine to review markets/patterns.
Since 2007, I've been doing this every single day/week/month.

Finding opportunities has become one of the best part of trading business.
Read 4 tweets
23 Sep
(1) Let's study this chart and discuss some of the concepts in classical charting & technical analysis. It is a great chart. Image
(2) Symmetrical triangle formed right below the 200-day average. Breakout took place at the same price level which I call inflection point. When such condition is met, it is a high conviction setup for me.
(3) Breakout took place with a gap opening. This was a clear breakaway gap as explained by Schabacker.

Breakout took place above the 200-day average and it was a change in trend as well. A significant technical development.
Read 4 tweets

Did Thread Reader help you today?

Support us! We are indie developers!


This site is made by just two indie developers on a laptop doing marketing, support and development! Read more about the story.

Become a Premium Member ($3/month or $30/year) and get exclusive features!

Become Premium

Too expensive? Make a small donation by buying us coffee ($5) or help with server cost ($10)

Donate via Paypal Become our Patreon

Thank you for your support!

Follow Us on Twitter!

:(