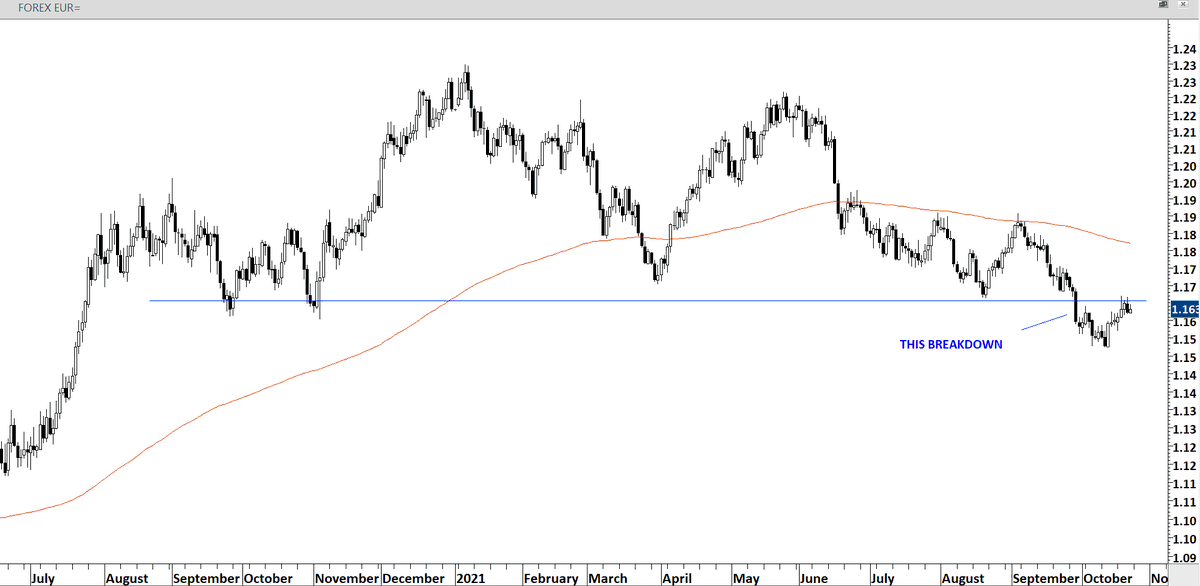
Update on $EUR #FX. Volatility is low. That means whichever direction we start accelerating, highly likely we get a decent trend.
I see this as a breakdown and pullback completed.
Update on $EURUSD
Update on $EURUSD. If we have a bearish flag, the next move will be sharply lower. Volatility is low which means any chart pattern completion can offer a strong directional movement. #FX
Strong breakdown. Bearish flag is possibly completed. $EURUSD #FX
The beauty of classical charting and technical analysis. $EURUSD. #FX $DXY
• • •
Missing some Tweet in this thread? You can try to
force a refresh
Chart patterns are confirmed when they are mature. It is usually difficult to understand at what level the pattern is mature. For me this is with several tests of pattern boundary.
First reversal signal on $BTC was covered with this setup.
Rising wedge breakdown was followed by a rebound which formed the right shoulder of a H&S top. The correction towards 30K was covered with this chart pattern setup.
Let the market give clues to the direction of the trend. We don't want to predict.
This is considered Type 2 breakout. (Explained in following videos).
Irrespective of time frame (note I don't analyze intraday price action), price dynamics are the same. Breakouts can be followed by pullbacks and those would ideally find support at the previous resistance.
Piyasada birileri..., dis gucler, soros, vs. gibi inanclari olan arkadaslar icin Isvec borsasinda islem goren bir hissenin grafigini paylasiyorum.
Piyasadaki o "birileri" ne atfedilen hareketler aslinda kolletif olarak toplu suru piskolojisi/insan davranislarindan kaynaklaniyor
Reference to earlier tweet on the price dynamics of a Type 2 breakout.
Define a research universe 500, 1000 names... depends on your time dedicated for market research each day & weekend.
Make sure you go through the same list every single day.
What you miss earlier you might capture later.
You see the development of price charts better
Open each chart with the same template. Don't go into style drift by saying: Hmm.. let me see what X indicator is doing or let me go into hourly chart etc.
You have 1hr (or how much it takes to finish the list you have built) to finish the work and move off the screen.
Before you finalize, see if any pattern fit your criteria. Save those to a separate folder and review them the next day first thing after the market close. That's your watchlist.