SMART MONEY DISTRIBUTE/ACCUMULATE [Part I]
🧵/1. One of the main newcomers' questions (particularly the mid-term players) is, "When does #SmartMoney sell/buy?". in a series of Quicktakes, we will utilize onchain & #FuturesMarklet metrics to estimate the dist/accum phases
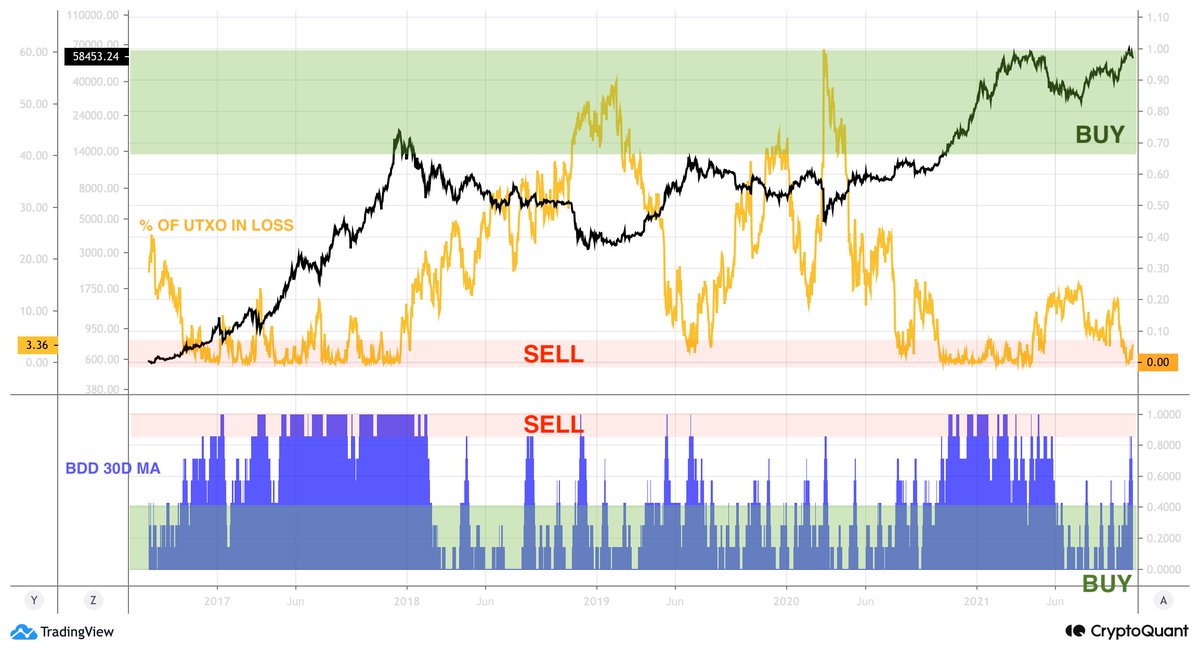
🧵/2. First, Let's look at the pair of A: 30D MA of Binary CDD 🔵and B: % of UTXO in Loss 🟠.
Distribution: A>0.85 & B<4% 🟩(OLD COIN SELL- EUPHORIA)
Accumulation: A<0.40 & B >40% 🟥(OLD COIN DORMANT - FEAR)
ARE WE AT DEC 2020 (ROCKET-LUNCH) LEVEL AGAIN?
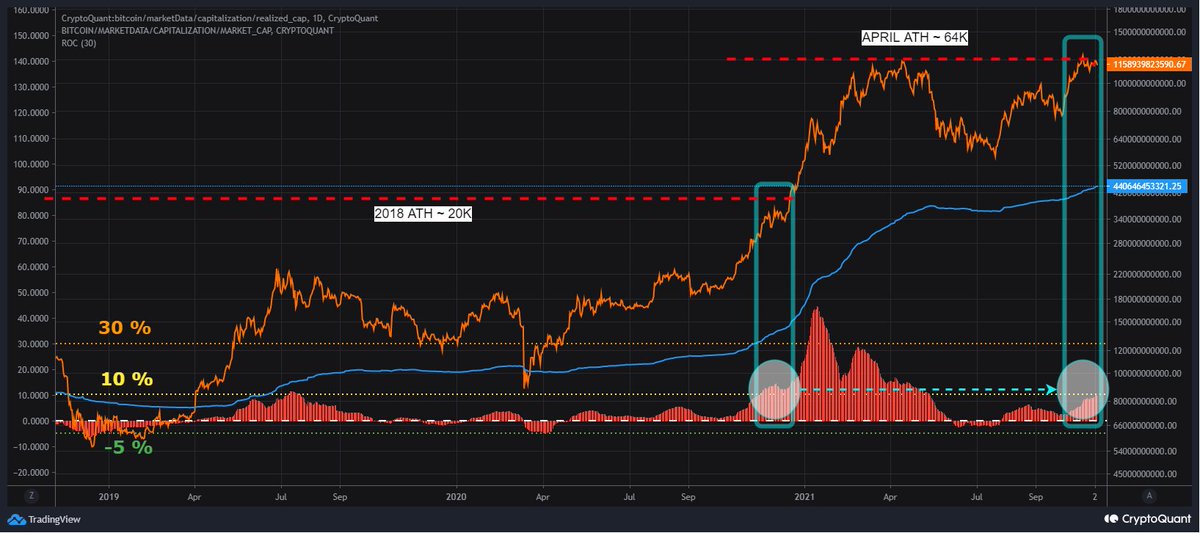
🧵/1. Here in this 🧵we look at the market structure from #onchain & #FuturesMarket perspectives and compare it with Dec 2020, when the price was breaking above the 2018's (20K) ATH for second time!
🧵/2. First, looking at the Monthly-Realized Profit Oscillator, we can see, similar to Dec 2020, market is approximately realizing equal to 5% of the total #RealizedCap monthly. This means we have not witnessed the old coins realizing profit at a concerning rate yet ( >10%).
🧵/3. The #FuturesMarket also has the same sentiment that the market had in Dec 2020. The #FundingRate is rising gradually, and #OpenInterest momentum (30D-RSI) has dropped (after reaching a new ATH; 67K) to the same level we saw in Dec 2020; 20K>18K> 🌙(Dec 20) = 67K > 58K > ?
SELL PRESSURE IN ALL EXCHANGES
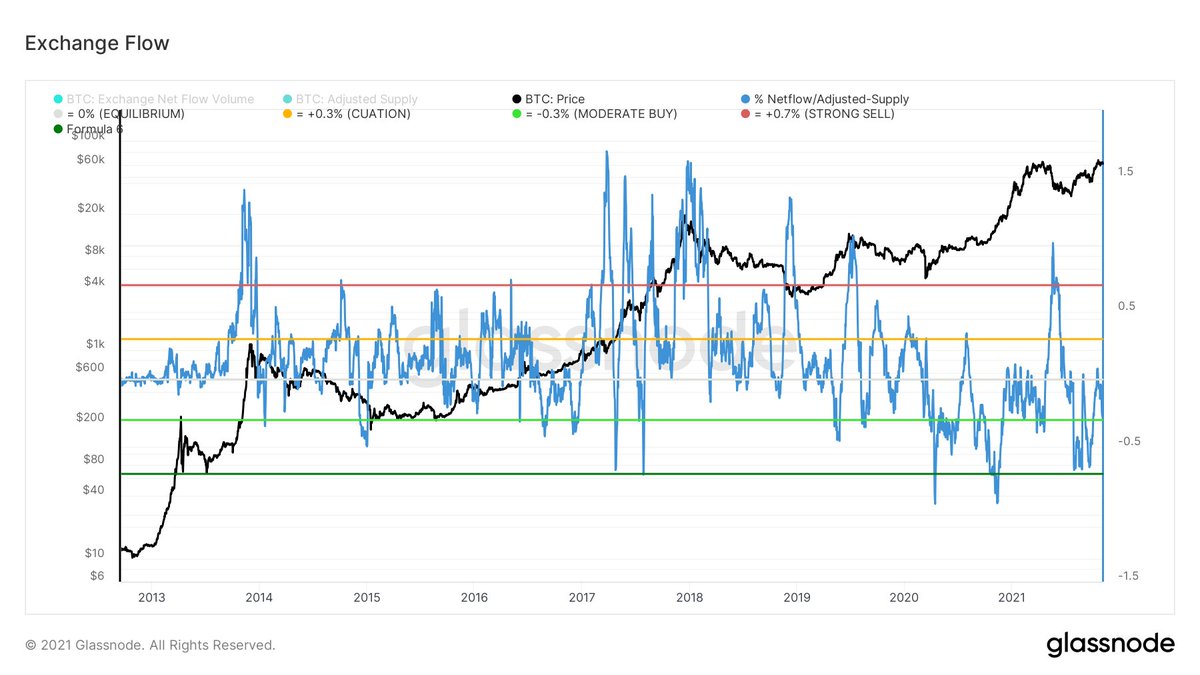
🧵/1.To estimate the intensity of in/outflows to/from all exchanges, we can measure the #NetFlow magnitude as % of adjusted supply (excluding lost & +7 year dormant). Here, I calculated the (30D-aggregated #NetFLow to all exchanges/adjusted supply)
🧵/2. At the market's 2013-14 & 2017-18 tops, we can see the monthly aggregated #NetFlow to all exchanges reached levels above > + 0.75% of adjusted supply.
🧵/3. Reversely, during the bearish periods, we had #NetFlow (withdrawal); - 0.5% to - 0.75%.
Comparing the current market structure with YTD historical data, we can see the #NetFlow levels is similar to Dec 2020 (#BTC ~ 20K); < 0.0%.
If I had some time, I would try “A network analysis of a Twitter hashtag.” Then you could see how ridiculous is #shitcoin marketing! First, main accounts start the #XYZ, then so-called genius TAs (famous) promote the new life-changing coin with their charts. SURE it will pump!
زمان اضافهای اگر داشتم، با یک مطالعه دقیق ثابت میکردم، چطور به صورت سازمان یافته معروفترین اکانتهای #تکنیکال#شتکوین ی (حتی فارسی زبان) ، سیگنالها رو خودآگاه یا ناخودآگاه، از یک منبع مشترک میگیرند. البته که پامپ خواهد شد! اما تاخیر زمانی پیوستن شما به این موج خندهدار است
به خدای بزرگ قسم که هیچ دِینی بر دوش شما نیست بابت کار کوچکی که میکنم. این وظیفه من در مورد کشورم و هموطنانم است.
اما دلم پر از درد است که ساعتها تلاش میکنم. با اشتیاق هزینه فکری و مالی بر خودم تحمیل میکنم.
با ۲-۳ شرکت مکاتبه میکنم که منت تحریم و ایرانی بودن را بر سر ما میگذارند. عملا التماس میکنم برای رایگان کردن بخشی از اطلاعاتشان !
در جواب میبیینم، مردم پول در جیب حرام لقمگانی میریزید که فخر ماشین و ساعتشان را به شما میفروشند.
دروغهایِ این بی شرافتان را که از مسیر خوردن خون شما، اعتبار کسب کردهاند، میخرند. کسانی که دیروز در اینستاگرام و امروز در منوتو و فردا … خدا داند کجا، پروموت میشوند.
بدانید از این پیشنهادها و قول پولها به افراد پر مخاطب زیاد انجام میشود.
🧵/1-Due to the innovative approach towards #BTC price valuation based on #Scarcity, the #S2F model by @100trillionUSD has attracted a lot of attention in the community since 2019. After the recent market's 50% drop, the S2F_price deflection from Market_price caused a huge debate
🧵/2- I have two theories for this descending behaviour in the #S2F deflection graph.
A- The #S2F model is only a function of Scarcity. However, Scarcity can be exaggerated/neutralized by other factors such as wealth distribution's equality in the network; Gini Coeff
🧵/3- Therefore, if we redefine the S2F model to include the Gini Index, we can improve the price prediction performance (lower deflection). Gini Coeff calculation requires T3 data offered by @glassnode (I don't have them) news.earn.com/quantifying-de…
1/10-Going through the 2nd week of the biggest corrections of this cycle (~ 50%), the ultimate questions in market are,
-Whether the cycle is over?
-How are the Exchange Flow conditions?
-What is the picture that on-chain metrics are giving about market in long-term?
🧵🔽
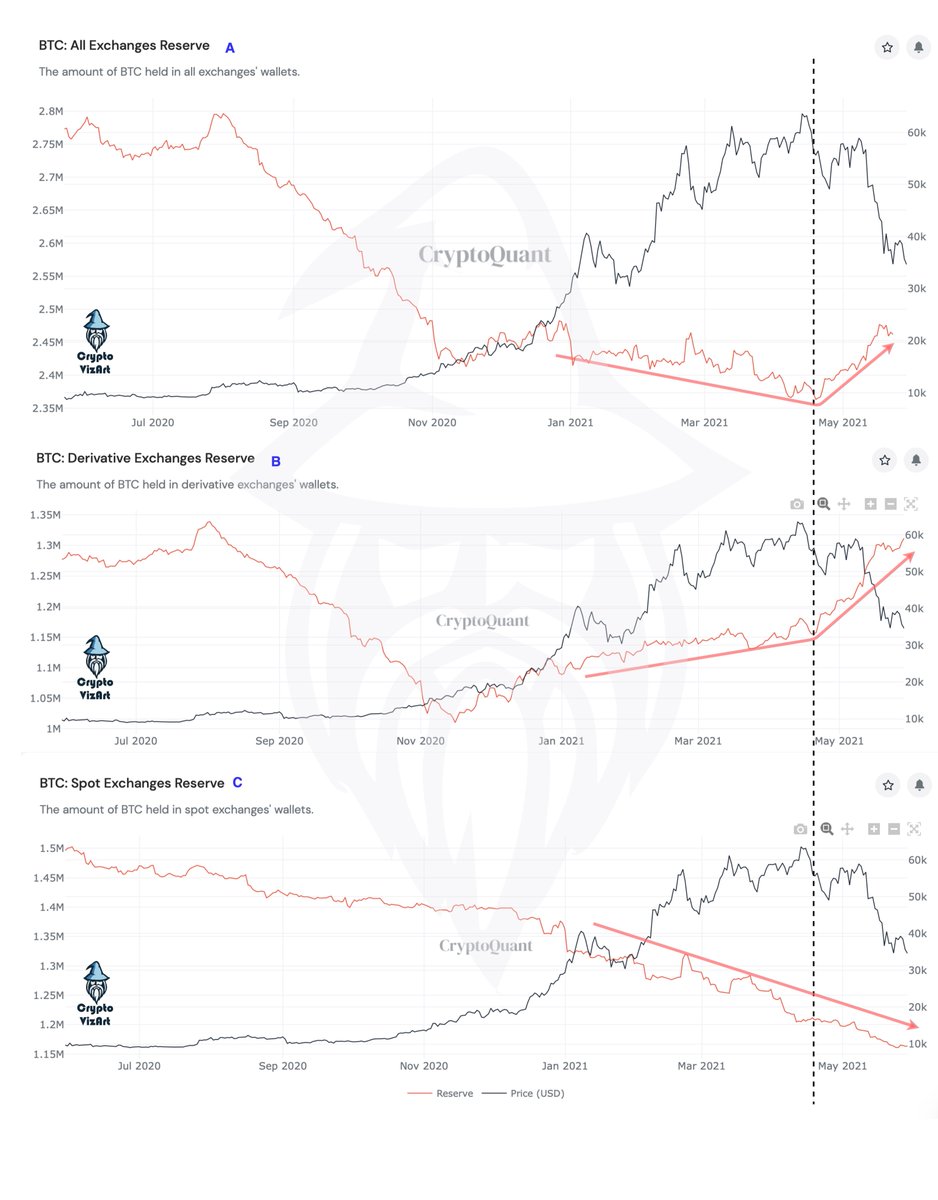
2/10- All-Exchanges Reserve has been declining since the beginning of this bull market. This trend was then upward on April 24th after prices dropped 64K > 50K [1A] = on-chain bearish sign.
3/10-Overall increasing level of bitcoin reserve on exchanges was due to Derivative-Exchanges (@Binance, @Bitrex )[1B]. The interesting point to notice here was the uninterrupted downtrend of bitcoin reserve on Spot-Exchanges (@Coinbase, @Kraken)[1C].