New paper today estimates the per capita emissions gaps for 1.5C of global income groups in 2030, based on NDCs
Richest 1% set for footprints 30x 1.5C-aligned global level
Richest 10% - 9x higher
Middle 40% - 2x higher
Poorest 50% - 2x lower
@IEEP_eu @Oxfam @SEIclimate #COP26
Richest 1% set for footprints 30x 1.5C-aligned global level
Richest 10% - 9x higher
Middle 40% - 2x higher
Poorest 50% - 2x lower
@IEEP_eu @Oxfam @SEIclimate #COP26

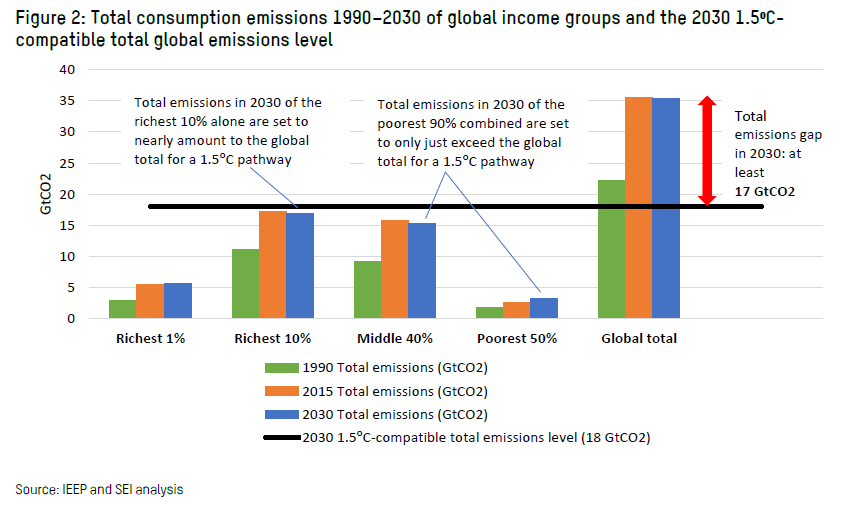
In absolute terms, the consumption emissions of the richest 10% in 2030 are set to nearly amount to the global total in 2030 compatible with 1.5C (18Gt)
The poorest 90% are set to only just exceed that level
This is the #inequality behind the #emissionsgap
The poorest 90% are set to only just exceed that level
This is the #inequality behind the #emissionsgap
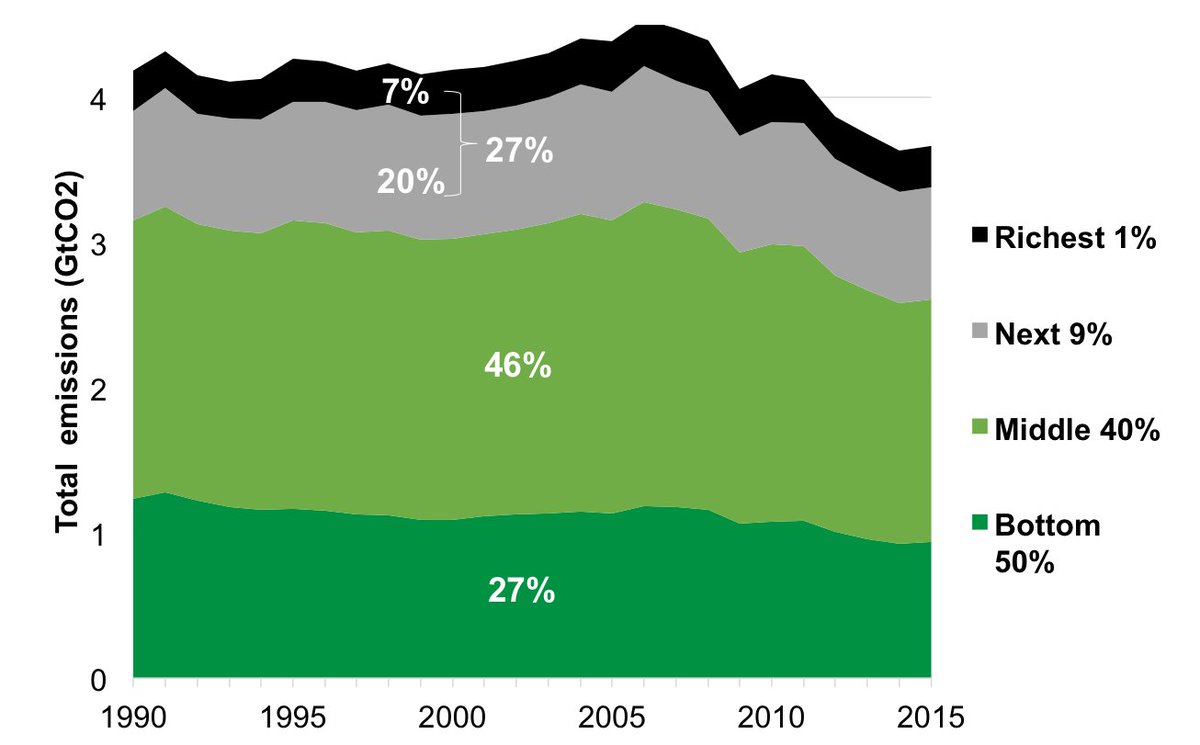
We estimate the share of emissions of the richest 1% are set to grow further following the 2015 Paris Agreement - reaching 16% of total global emissions by 2030
#inequality #COP26 #COP26Glasgow
#inequality #COP26 #COP26Glasgow

NDCs ahead of #COP26 mean emissions cuts 4 the richest 1% of just 5% - compared to 97% needed to align with the 1.5C global per capita level
Richest 10% set for 11% cuts vs 90% needed
Mid 40% = 9% vs 57% needed
Poorest 50% cld increase a bit, but still way below that level
Richest 10% set for 11% cuts vs 90% needed
Mid 40% = 9% vs 57% needed
Poorest 50% cld increase a bit, but still way below that level

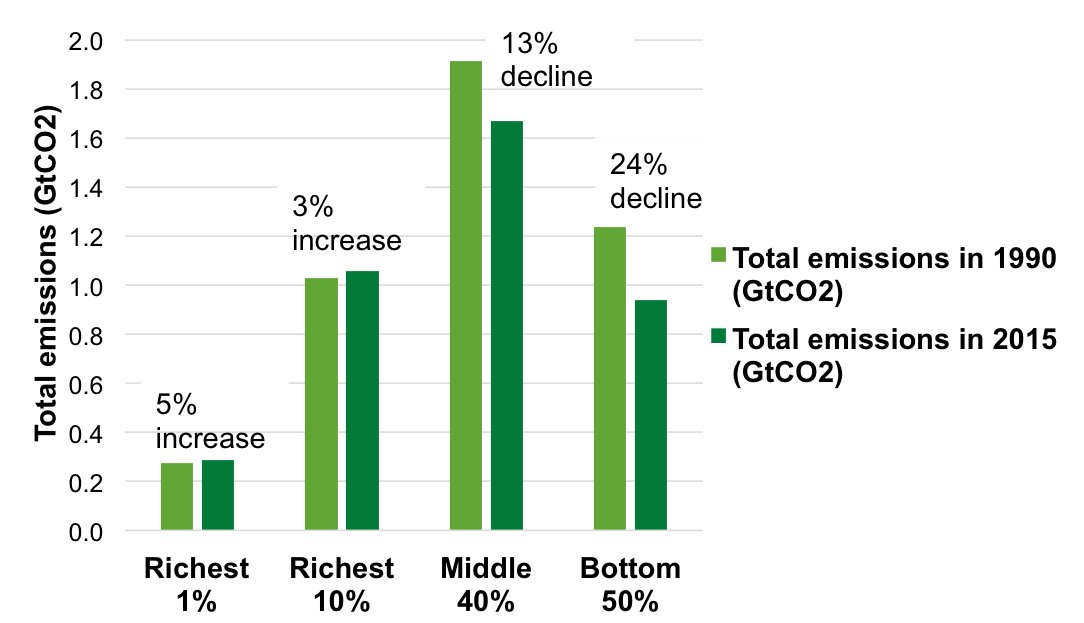
Biggest turnaround in emissions trends set to come from the global 'middle classes' - from rapid emissions growth 1990-2015 to emissions peak and plateau this decade - it's a sign of the 'Paris effect'
Deepest cuts set to come from lower/middle income citizens in rich countries
Deepest cuts set to come from lower/middle income citizens in rich countries

The geography of #carboninequality is changing. But 2030 we expect the biggest share of the emissions of the richest 1% from citizens of China - overtaking the USA - then India, then EU. Saudi Arabia and Brazil the next biggest contributors to emissions of the super rich
#COP26
#COP26

#carboninequality also extreme at national level
In all major emitters, the richest 10% are set for footprints way in excess of the 1.5C global per capita level in 2030
Tackling #inequality must go hand in hand with cutting emissions #COP26 #COP26Glasgow
In all major emitters, the richest 10% are set for footprints way in excess of the 1.5C global per capita level in 2030
Tackling #inequality must go hand in hand with cutting emissions #COP26 #COP26Glasgow

The new report is by @IEEP_eu for @Oxfam with @SEIclimate available here: policy-practice.oxfam.org/resources/carb…
Based on last year's work here policy-practice.oxfam.org/resources/conf… & policy-practice.oxfam.org/resources/the-…
#COP26 #COP26Glasgow #inequality #ClimateCrisis
Based on last year's work here policy-practice.oxfam.org/resources/conf… & policy-practice.oxfam.org/resources/the-…
#COP26 #COP26Glasgow #inequality #ClimateCrisis
.@GeorgeMonbiot
@GretaThunberg
@StuartBCapstick
@KevinClimate
@lucas_chancel
@jasonhickel
@edking_I
@vanessa_vash
@SelwinHart
@lewisakenji
@KateRaworth
@JKSteinberger
@yl_oswald
@farhanaclimate
@chilledasad100 @DoctorVive @DrDanONeill @StephenLeahy
@GretaThunberg
@StuartBCapstick
@KevinClimate
@lucas_chancel
@jasonhickel
@edking_I
@vanessa_vash
@SelwinHart
@lewisakenji
@KateRaworth
@JKSteinberger
@yl_oswald
@farhanaclimate
@chilledasad100 @DoctorVive @DrDanONeill @StephenLeahy
• • •
Missing some Tweet in this thread? You can try to
force a refresh