𝗖𝗧𝗠 #𝗕𝗧𝗖 𝗢𝗻-𝗖𝗵𝗮𝗶𝗻 𝗠𝗲𝘁𝗿𝗶𝗰 𝗗𝗮𝘀𝗵𝗯𝗼𝗮𝗿𝗱: 𝗪𝗲𝗲𝗸 𝟰𝟯 '𝟮𝟭
Price Action Indicators (Fundamentals that affect BTC's price)
TLDR:📈
1. Miner metrics- Mod. Bullish
2. Supply metrics- Bullish
3. Institution demand- Bullish
4. Network metrics- Bullish
Price Action Indicators (Fundamentals that affect BTC's price)
TLDR:📈
1. Miner metrics- Mod. Bullish
2. Supply metrics- Bullish
3. Institution demand- Bullish
4. Network metrics- Bullish
𝟭. 𝗠𝗶𝗻𝗲𝗿 𝗠𝗲𝘁𝗿𝗶𝗰𝘀
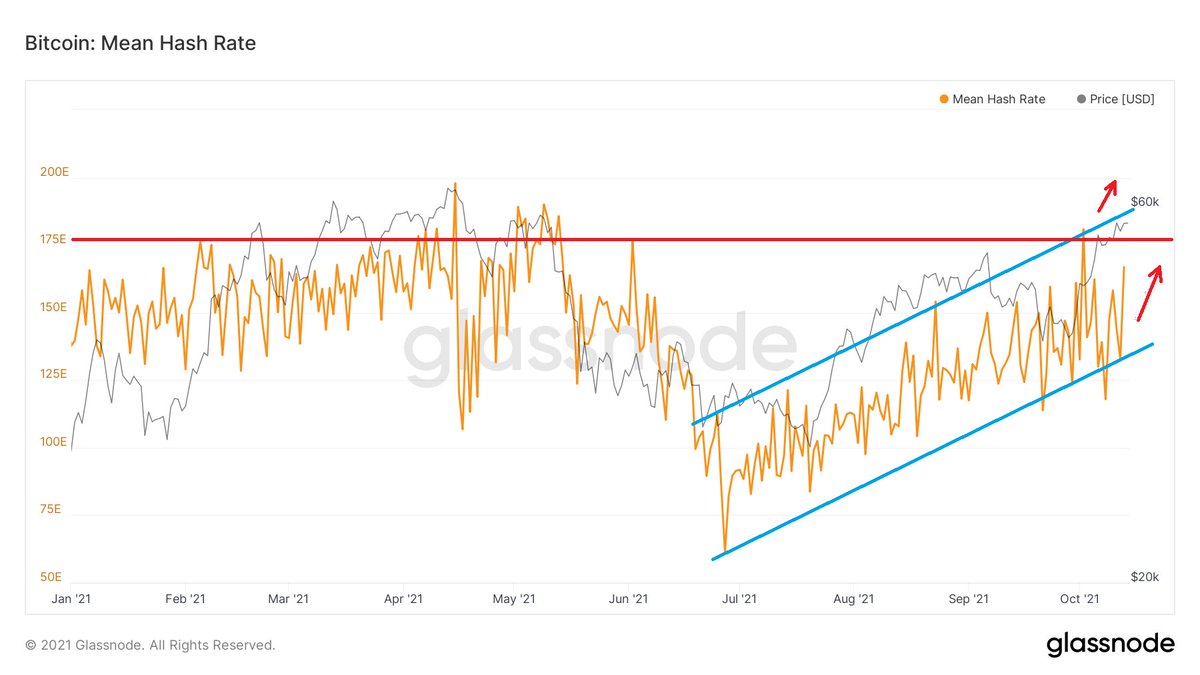
a. Hash Rate
Technically, the #BTC hash rate forms an ascending channel. After reaching the top part of the channel, it got rejected & is consolidating around the bottom of the channel. Let's see if will rebound from here.
Slightly bearish.
a. Hash Rate
Technically, the #BTC hash rate forms an ascending channel. After reaching the top part of the channel, it got rejected & is consolidating around the bottom of the channel. Let's see if will rebound from here.
Slightly bearish.

1b(i) The Hash Ribbon is a market indicator that assumes that #BTC's price tends to reach a bottom when miners capitulate & that's when BTC's price momentum switches from negative to positive- a good buying opportunity.

1b(ii) The Hash Ribbon flashed buy signals twice during this bull phase & #BTC's price rallied by 1.5x-2.6x. Hash Ribbon buy signal was still intact last week.
If history rhymes, this will put BTC around $106K as it has broken its previous ATH already!
If history rhymes, this will put BTC around $106K as it has broken its previous ATH already!
1c #BTC miner balance increased by 335 BTC last week. The monthly change in miner's BTC balance for October 2021 is positive.
Weekly change: +335 BTC
Monthly change: +1028 BTC
Nov 1-2 change: +326 BTC
Miner balance increased by 326 BTC in the first 2 days of November. Bullish!
Weekly change: +335 BTC
Monthly change: +1028 BTC
Nov 1-2 change: +326 BTC
Miner balance increased by 326 BTC in the first 2 days of November. Bullish!
𝟮. 𝗦𝘂𝗽𝗽𝗹𝘆 𝗠𝗲𝘁𝗿𝗶𝗰𝘀
a(i) The Net #BTC Transfer Vol. to/from Exchanges (NTVE) is inversely correlated with BTC's price.
NTVE was net -ve last week, but BTC is consolidating ~$58K-$63K. There is a divergence in this metric as NTVE is -ve, but price is trending down.
a(i) The Net #BTC Transfer Vol. to/from Exchanges (NTVE) is inversely correlated with BTC's price.
NTVE was net -ve last week, but BTC is consolidating ~$58K-$63K. There is a divergence in this metric as NTVE is -ve, but price is trending down.

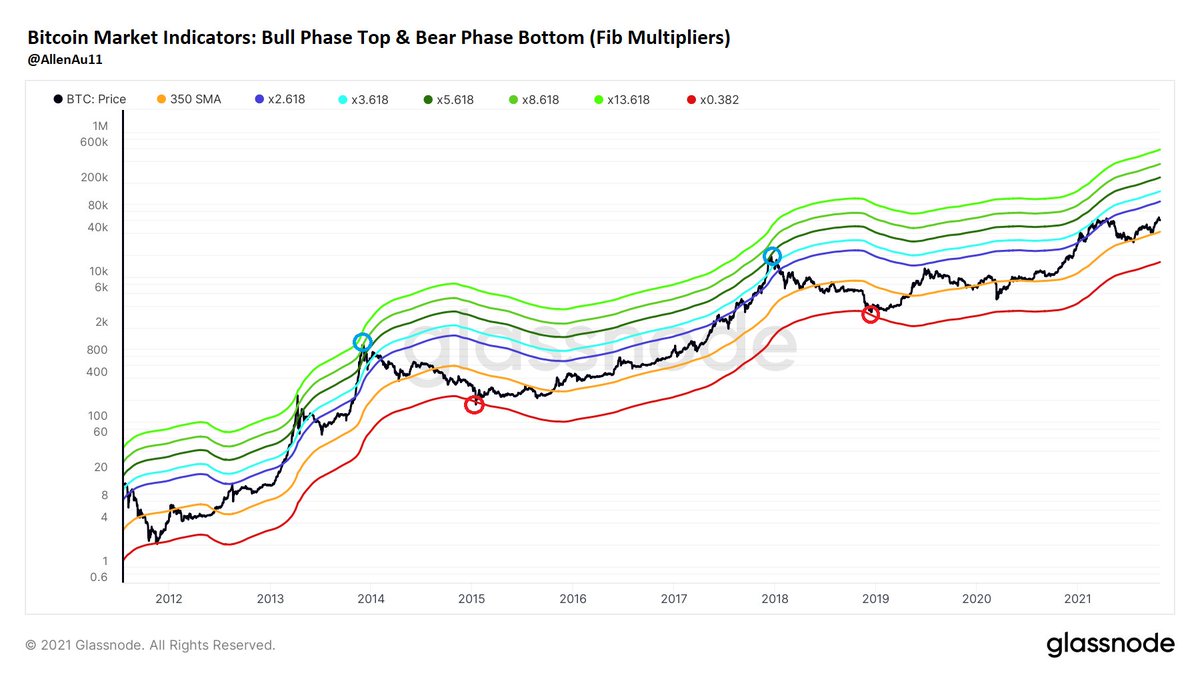
2a(ii) #BTC could still peak around $360K based on my pinned tweet under 2(ii)(c).

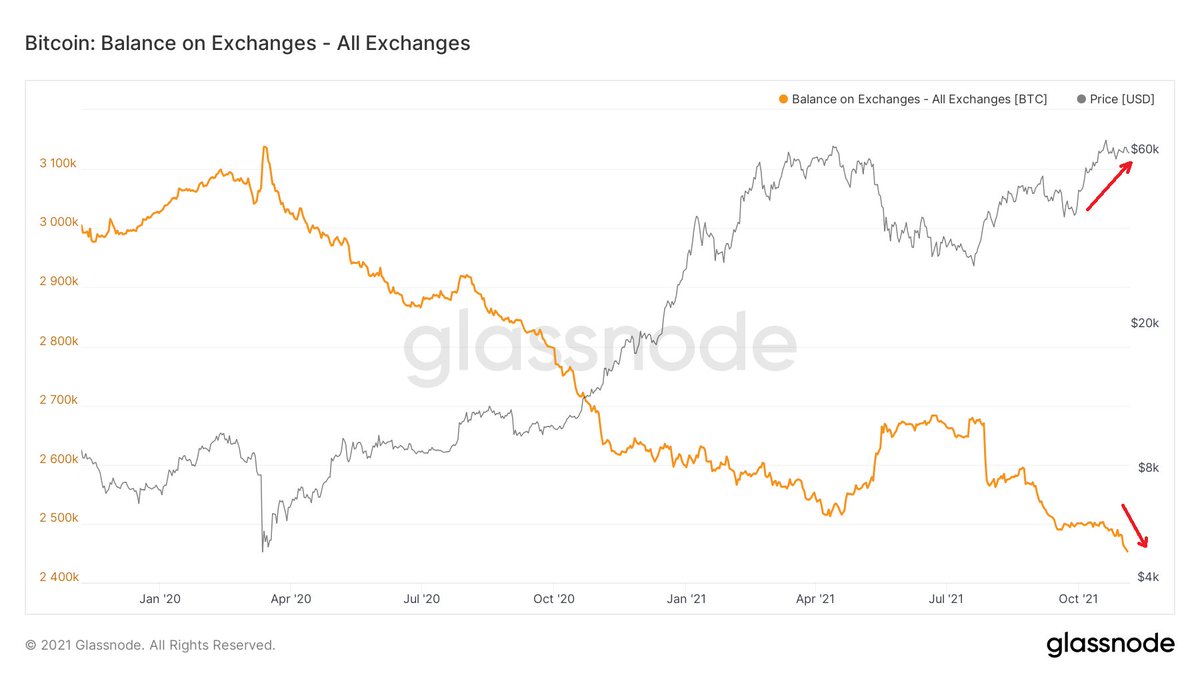
2b The balance of #BTC on Exchanges decreased last week. Since July 2021, BTC balances on exchanges have decreased & October 2021 posted the 3rd largest decline. This trend indicates a supply squeeze is in full swing. Bullish!
Weekly Change: -4061 BTC
Monthly Change: -20213 BTC
Weekly Change: -4061 BTC
Monthly Change: -20213 BTC
2c Last week, Whales bought 5459 #BTC, but Tiger Sharks were the largest buyer. Great Whites & Fish took profits last week.
In October 2021, Great Whites & Tiger Sharks were the key buyers of BTC, while Fish were the biggest sellers.
In October 2021, Great Whites & Tiger Sharks were the key buyers of BTC, while Fish were the biggest sellers.

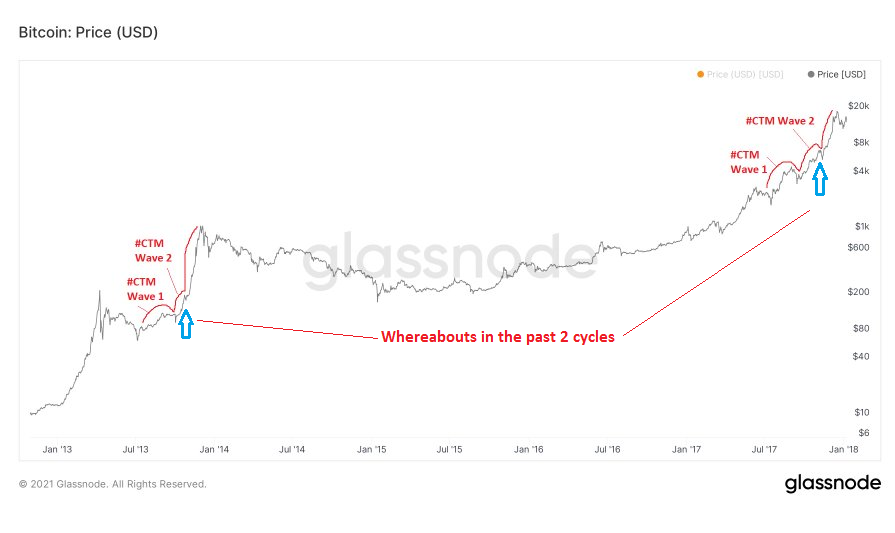
2d(i) The LT HODLers' #BTC supply falls as BTC's price ascends to its interim or cycle peak.
The current trend of old coins mimics the 2013 BTC bull phase- LT HODLers stacking sats before the cycle peak.
Their BTC holdings set a new ATH of 12.3M coins. Still trending up!!!
The current trend of old coins mimics the 2013 BTC bull phase- LT HODLers stacking sats before the cycle peak.
Their BTC holdings set a new ATH of 12.3M coins. Still trending up!!!

2d(ii) The Spent Output Age Bands (SOAB) show that LT HODLers are holding onto most of their coins.
In 2013, SOAB continued to rise until #BTC's cycle peak. In 2017, it rose at first & then fell as BTC peaked.
Now, SOAB is more like that in 2017 at this time in past cycles.
In 2013, SOAB continued to rise until #BTC's cycle peak. In 2017, it rose at first & then fell as BTC peaked.
Now, SOAB is more like that in 2017 at this time in past cycles.

𝟯. 𝗜𝗻𝘀𝘁𝗶𝘁𝘂𝘁𝗶𝗼𝗻𝗮𝗹 𝗗𝗲𝗺𝗮𝗻𝗱
Last week, 28080 BTC or $1.72B worth of #BTC were withdrawn from Coinbase to cold storage.
Just in the first 4 days of November, 35992 BTC or $3.93B worth were bought by institutions & 50% of which was purchased at $61K!
Last week, 28080 BTC or $1.72B worth of #BTC were withdrawn from Coinbase to cold storage.
Just in the first 4 days of November, 35992 BTC or $3.93B worth were bought by institutions & 50% of which was purchased at $61K!

𝟰𝗮. 𝗡𝗲𝘁𝘄𝗼𝗿𝗸 𝗠𝗲𝘁𝗿𝗶𝗰𝘀
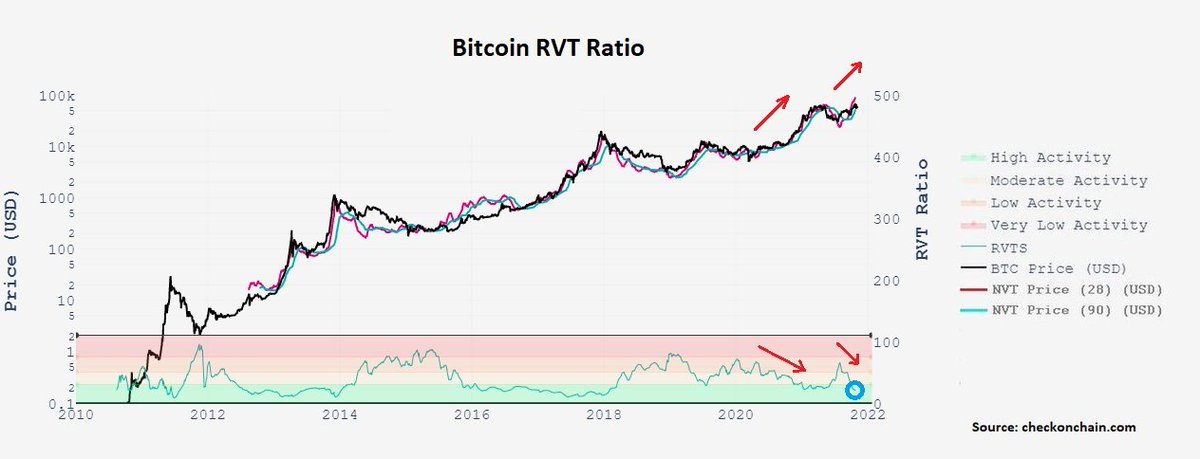
#BTC RVT Ratio is the realized market cap of BTC to transaction volume ratio.
RVTS (inverse of RVT Ratio) continues to be in High Activity. If this continues, BTC's price should rise at least like it did when it rallied to its previous ATH.
#BTC RVT Ratio is the realized market cap of BTC to transaction volume ratio.
RVTS (inverse of RVT Ratio) continues to be in High Activity. If this continues, BTC's price should rise at least like it did when it rallied to its previous ATH.
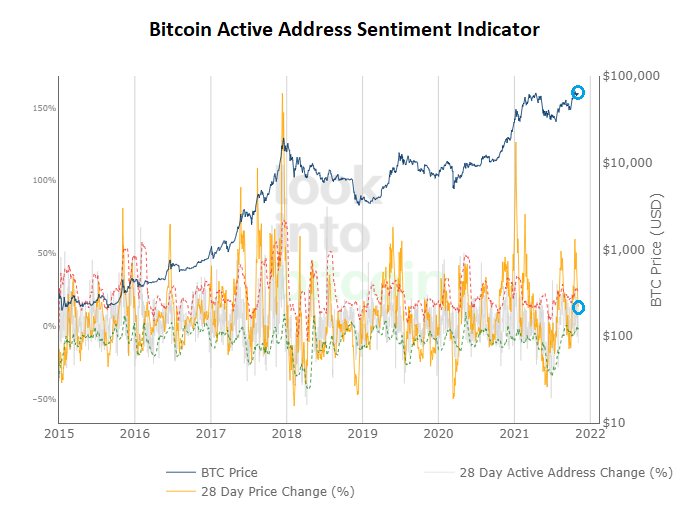
4b. The #BTC Active Address Sentiment Indicator has fallen back below the red dotted line (upper std. dev. band of 28D active address change). This shows that market sentiment went from overheated to neutral. This is healthy as BTC moves another leg higher.
@threadreaderapp unroll
• • •
Missing some Tweet in this thread? You can try to
force a refresh