Nice 5M $MATIC trade breakdown.
A quick share with you on the actual and potential on this one.
Low leverage move, result comes in.
Use this technique on your fave #Altcoins or #cryptocurrencies
A quick share with you on the actual and potential on this one.
Low leverage move, result comes in.
Use this technique on your fave #Altcoins or #cryptocurrencies

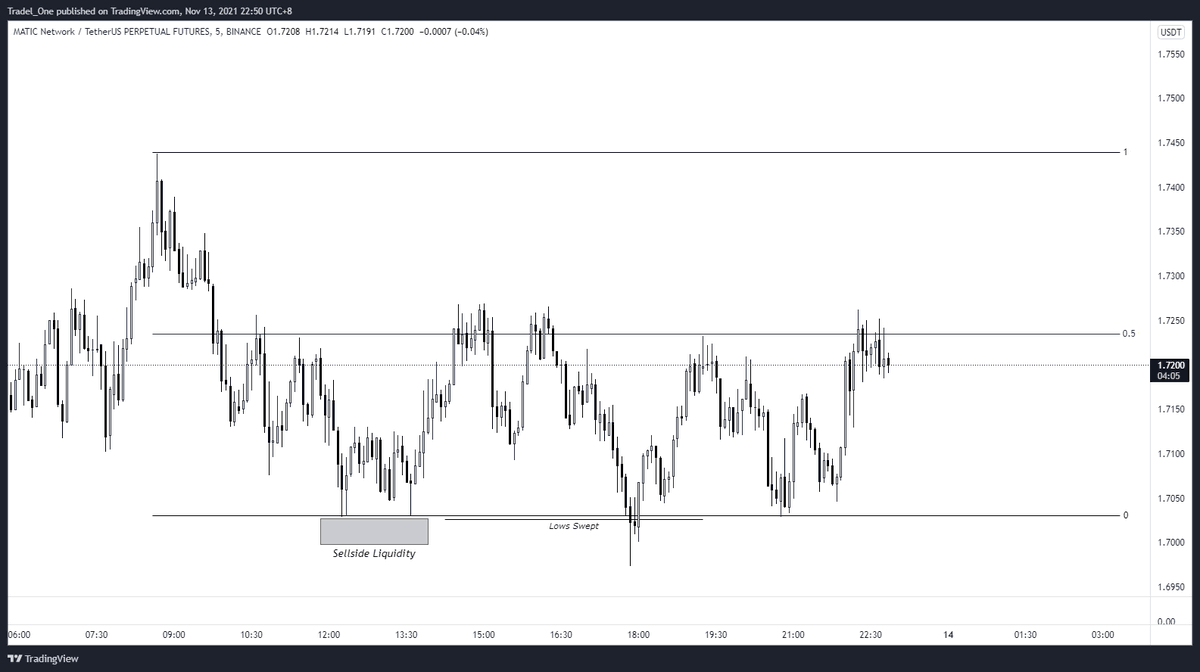
So we establish the range, we can see that there are a couple of MSB's to the upside that set us up for an uptrend in price
A bullish order block / supply is hit, where price runs up to another MSB, which really confirms our bias for the next move
A bullish order block / supply is hit, where price runs up to another MSB, which really confirms our bias for the next move

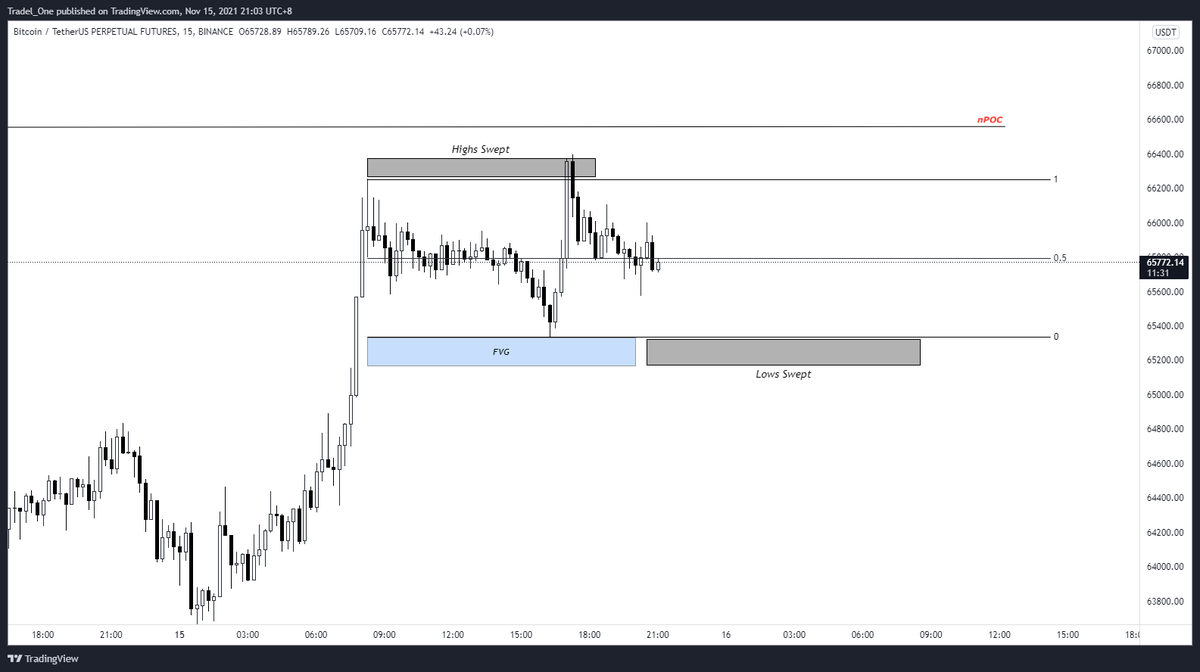
Then we can ask ourselves where is the liquidity that price is likely to be drawn to?
My feeling was that the recent range highs hadn't been run yet, so a good initial target resides there.
Resistance lives in the form of 5M bearish orderblock / supply as shown
My feeling was that the recent range highs hadn't been run yet, so a good initial target resides there.
Resistance lives in the form of 5M bearish orderblock / supply as shown

Entry shown per the below for the set up.
SL placed lower than the '1' level on the fib in case of some sudden price moves in this LTF
Another target outside of the 5M supply is the FVG on the 15M timeframe (5M chart shown here)
But I'm aiming for the order block only
SL placed lower than the '1' level on the fib in case of some sudden price moves in this LTF
Another target outside of the 5M supply is the FVG on the 15M timeframe (5M chart shown here)
But I'm aiming for the order block only


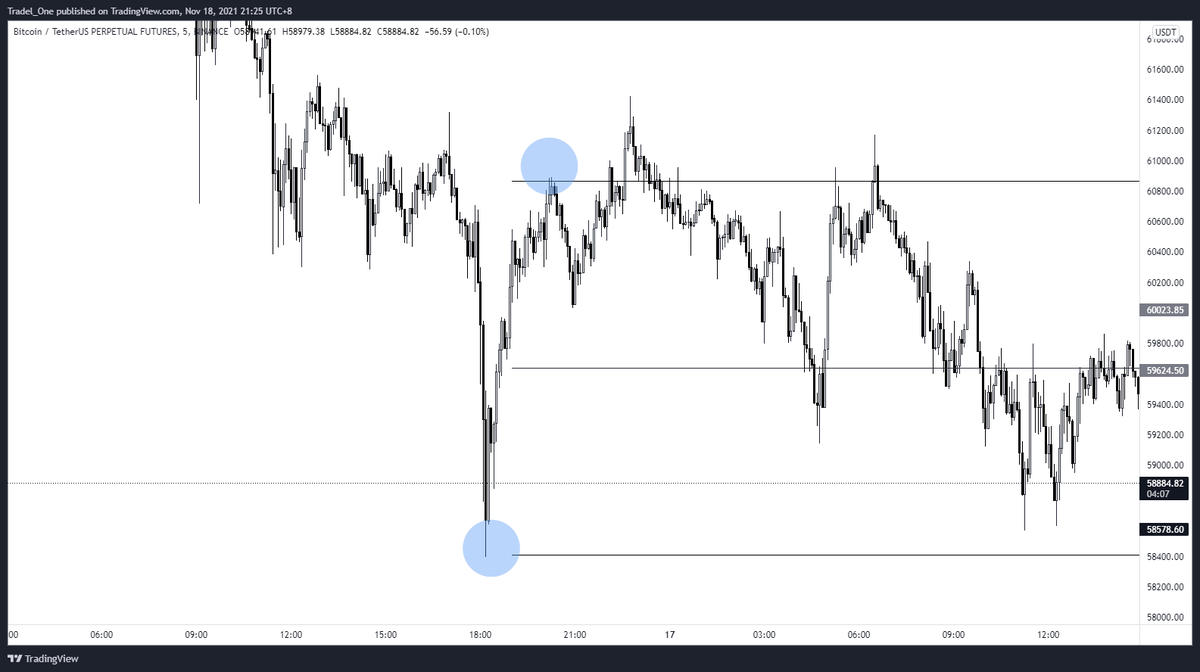
Entry made based on a limit order, and the idea about the run on entry in the LTF plays out in our favour

Target was hit and profits taken (P&L taken just before close)


Post trade:
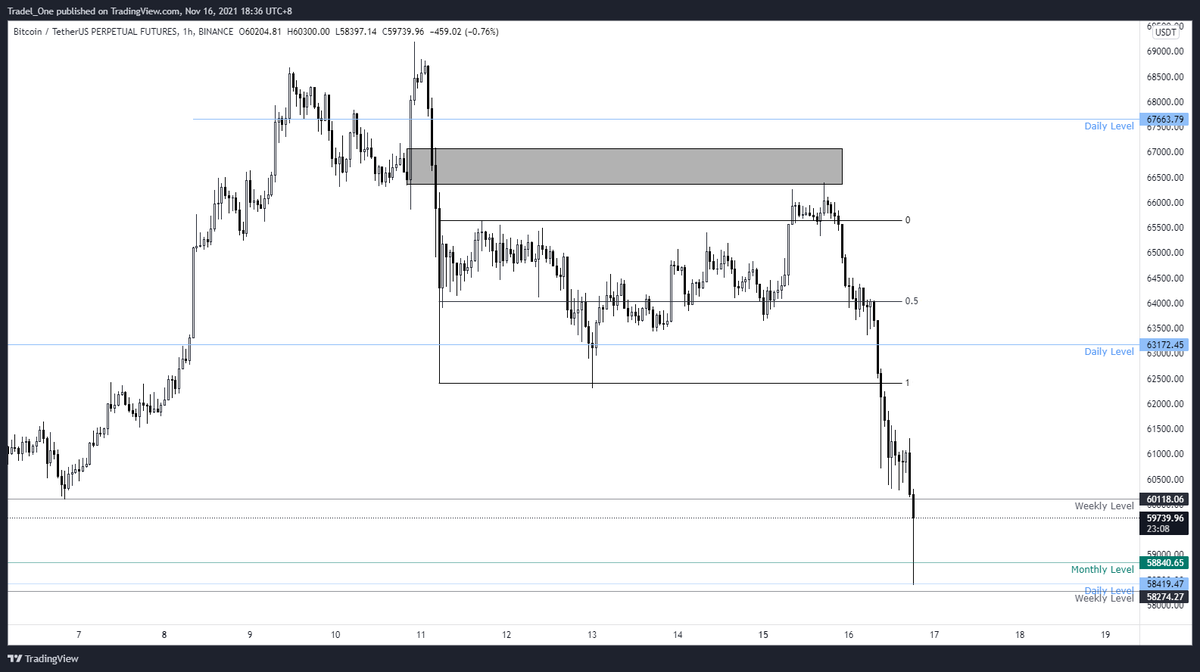
FVG was run well and truly. Could've, should've, would've held to the FVG, but my plan was to stick with the orderblock as shown.
Stick with your plan, but don't always be a robot
Note also that the 21 & 50 EMA's were in our favour for entry also
FVG was run well and truly. Could've, should've, would've held to the FVG, but my plan was to stick with the orderblock as shown.
Stick with your plan, but don't always be a robot
Note also that the 21 & 50 EMA's were in our favour for entry also


Conclusion
Take the time to set up your trade, identify the trend either through PA or EMA's, the target, & then stick with a plan, whether it be full profit take, or partials up to a level.
Hopefully this helps you out - stay hungry, and say hi to the old chook for me
Cheers
Take the time to set up your trade, identify the trend either through PA or EMA's, the target, & then stick with a plan, whether it be full profit take, or partials up to a level.
Hopefully this helps you out - stay hungry, and say hi to the old chook for me
Cheers
• • •
Missing some Tweet in this thread? You can try to
force a refresh