As promised folks, here is a method that will help your trading, I call it Structured Fibs or SF Method
There are four things to use
- Fibonacci levels (overall, and targets set ups below)
- Stoch RSI
- 200 EMA
- Market Structure
Let's take a look at this $BTC #Bitcoin set up
There are four things to use
- Fibonacci levels (overall, and targets set ups below)
- Stoch RSI
- 200 EMA
- Market Structure
Let's take a look at this $BTC #Bitcoin set up

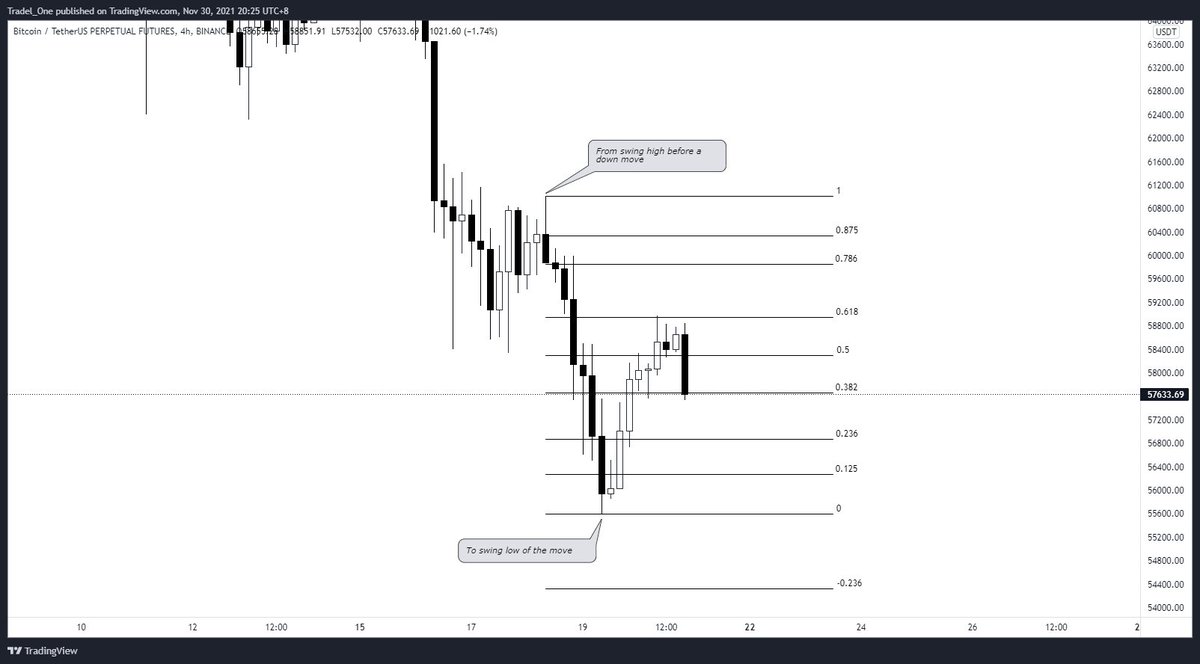
First, you want to set up your fib levels.
Follow the below to see how I do it.
First example are the full suite of fibs that you set up on a high level, second set of fibs are the target entry fibs
Follow the below to see how I do it.
First example are the full suite of fibs that you set up on a high level, second set of fibs are the target entry fibs


Then, the most important thing is this:
Set your fibs up on the timeframe ABOVE the timeframe you intend on trading on.
Eg I would set fibs up on the 4H if I was going to trade on the 1H, or I would use the 1H to trade on the 15M, or the 15M to trade on the 5M
4H & 1H below:
Set your fibs up on the timeframe ABOVE the timeframe you intend on trading on.
Eg I would set fibs up on the 4H if I was going to trade on the 1H, or I would use the 1H to trade on the 15M, or the 15M to trade on the 5M
4H & 1H below:

Then what you want to do is fire up the 200 EMA
If price is trading below the EMA, then only focus on shorts.
If price is trading above the EMA, then only focus on longs
REMEMBER: Trade with the trend if you're struggling with counter trend moves
This is your directional bias
If price is trading below the EMA, then only focus on shorts.
If price is trading above the EMA, then only focus on longs
REMEMBER: Trade with the trend if you're struggling with counter trend moves
This is your directional bias


Then, we add the Stochastic RSI (free indicator on @tradingview)
I keep the 14,3,3 settings if I use this - settings are shown here
I keep the 14,3,3 settings if I use this - settings are shown here


Then the last ingredient is Market Structure.
I call it the Structured Fib Method because we are using our fib set ups to simply beat the previous market structure.
We don't aim for extravagant targets, we simply have one target and no TP's.
(keep reading!)
I call it the Structured Fib Method because we are using our fib set ups to simply beat the previous market structure.
We don't aim for extravagant targets, we simply have one target and no TP's.
(keep reading!)

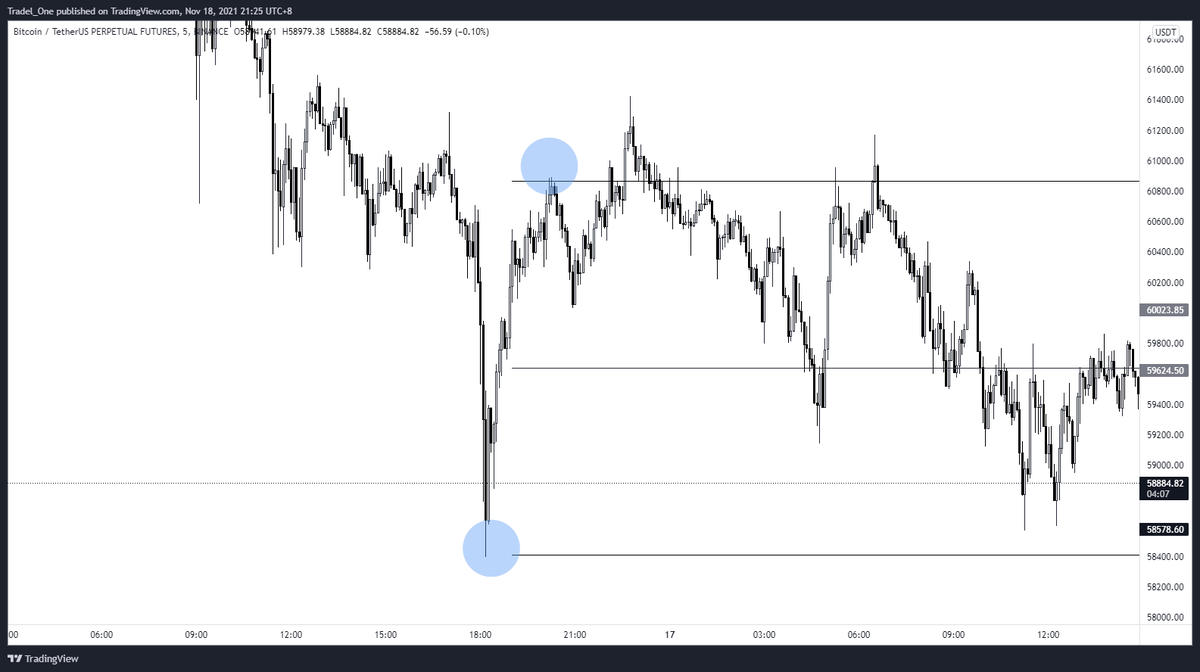
Notice how the previous market structure was beaten (ie previous swing low) - this then offers us up a potential upcoming short as:
- We are under the 200 EMA
and
- Have broken previous market structure (lower low)
How do we trade this?
Keep going!
👇👇👇
- We are under the 200 EMA
and
- Have broken previous market structure (lower low)
How do we trade this?
Keep going!
👇👇👇

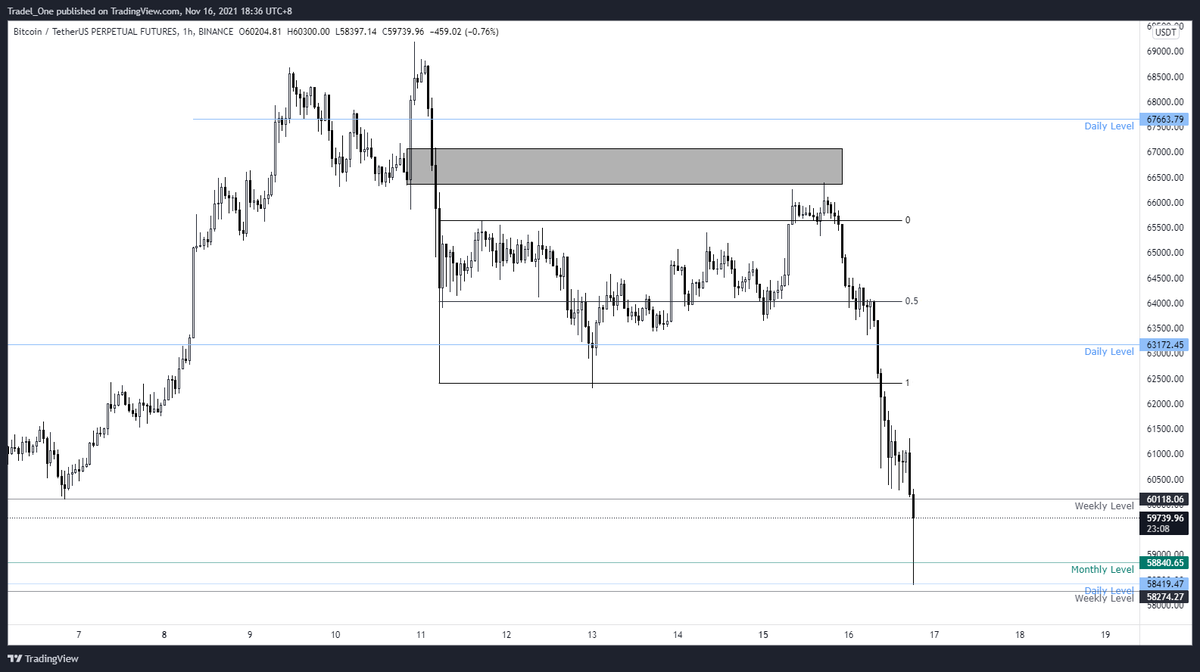
So we've got our overall fibs in play from the 4H. These are the key levels you want to look for entry on.
If you also pull your entry fibs and there is confluence with both sets of fibs, and under 200EMA for a short, then you're laughing
0.618 levels lining up on the below:
If you also pull your entry fibs and there is confluence with both sets of fibs, and under 200EMA for a short, then you're laughing
0.618 levels lining up on the below:

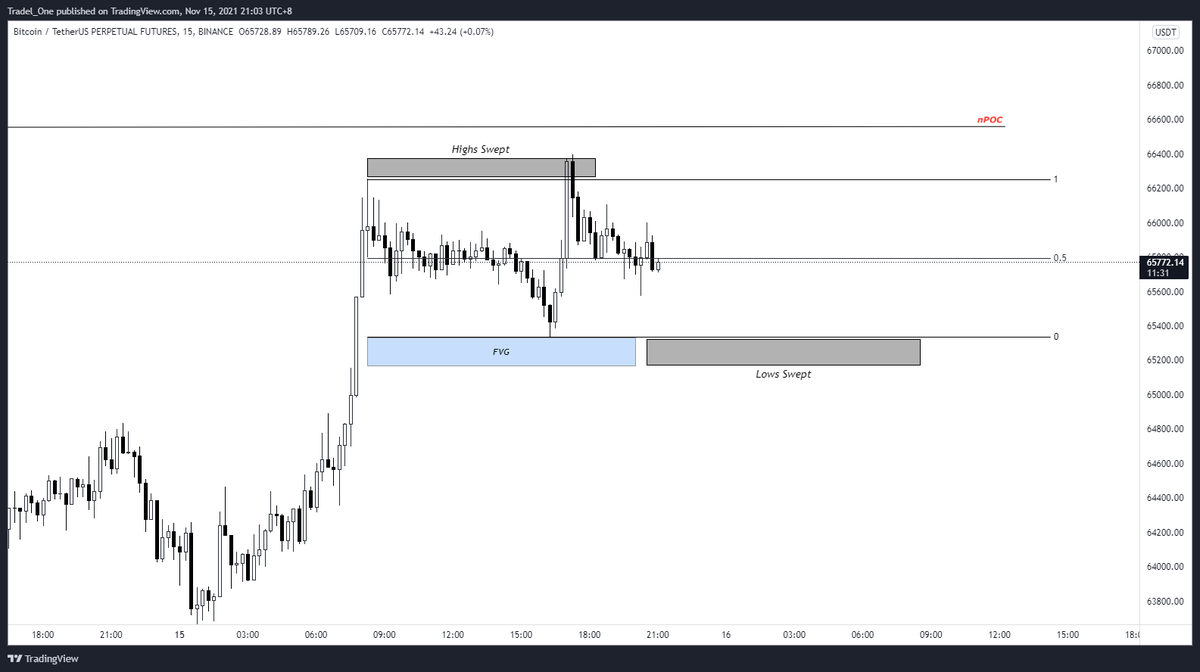
One more thing though, you're also looking for one more bit of confluence:
The Stochastic RSI
If shorting, this ideally should be oversold (above 80 - see blue circle), but I'm sharing this example with you to show that even lower signals can be good entries too (red circle)
The Stochastic RSI
If shorting, this ideally should be oversold (above 80 - see blue circle), but I'm sharing this example with you to show that even lower signals can be good entries too (red circle)

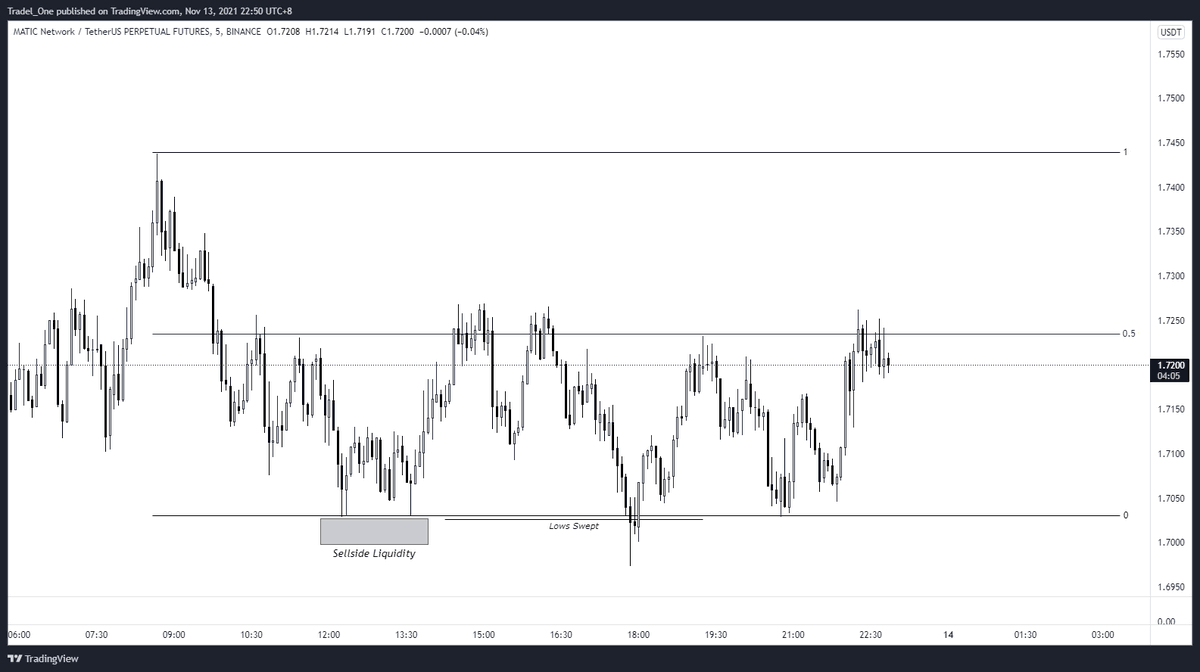
So this trade lined up with the 0.618 level of the overall fibs, the 0.618 level of the target fibs, and the Stoch RSI was also on it's way to oversold.
This would have been just under 2R if you took the trade.
So that's it.
Simple as fuck right? Give it a whirl yourself
This would have been just under 2R if you took the trade.
So that's it.
Simple as fuck right? Give it a whirl yourself
RECAP
- Draw your overall fibs on the TF above the TF you want to trade
- Wait for market structure to be broken
- Pull entry fibs
- Aim for oversold or overbought Stoch RSI levels
- Trade with the trend (200 EMA)
- Aim for prev MS only
- Draw your overall fibs on the TF above the TF you want to trade
- Wait for market structure to be broken
- Pull entry fibs
- Aim for oversold or overbought Stoch RSI levels
- Trade with the trend (200 EMA)
- Aim for prev MS only
This method can be used on any timeframe, and can be used for both long and shorting opportunities.
For longs, just flip the method ie directional bias for longs when price is trading above the 200EMA, Stoch RSI is oversold, and market structure has been beaten
For longs, just flip the method ie directional bias for longs when price is trading above the 200EMA, Stoch RSI is oversold, and market structure has been beaten
It's been a while, so say hi to the old chook for me, keep smashing the trading, and stay hungry!
Thanks to @Delta_Exchange for your continued support, and if you'd like to trade over there, use the below ref link for a discount on fees!
delta.exchange/MindsetBTC
Thanks to @Delta_Exchange for your continued support, and if you'd like to trade over there, use the below ref link for a discount on fees!
delta.exchange/MindsetBTC
My bad as well guys on one item - in the short opportunities, look for overbought entries, not oversold sorry as I've mentioned here.
Oversold is for longs only
(I always fuck that one up!)
Cheers
Oversold is for longs only
(I always fuck that one up!)
Cheers
• • •
Missing some Tweet in this thread? You can try to
force a refresh