Did a poll in my TG Group - and PA was what people wanted to see most, so:
Let's take a look at $SRM
Agenda:
- Range
- FVG's
- nPOC's
- Potential PO3
- Putting it all together
- $BTC and behaving itself
Let's take a look at $SRM
Agenda:
- Range
- FVG's
- nPOC's
- Potential PO3
- Putting it all together
- $BTC and behaving itself

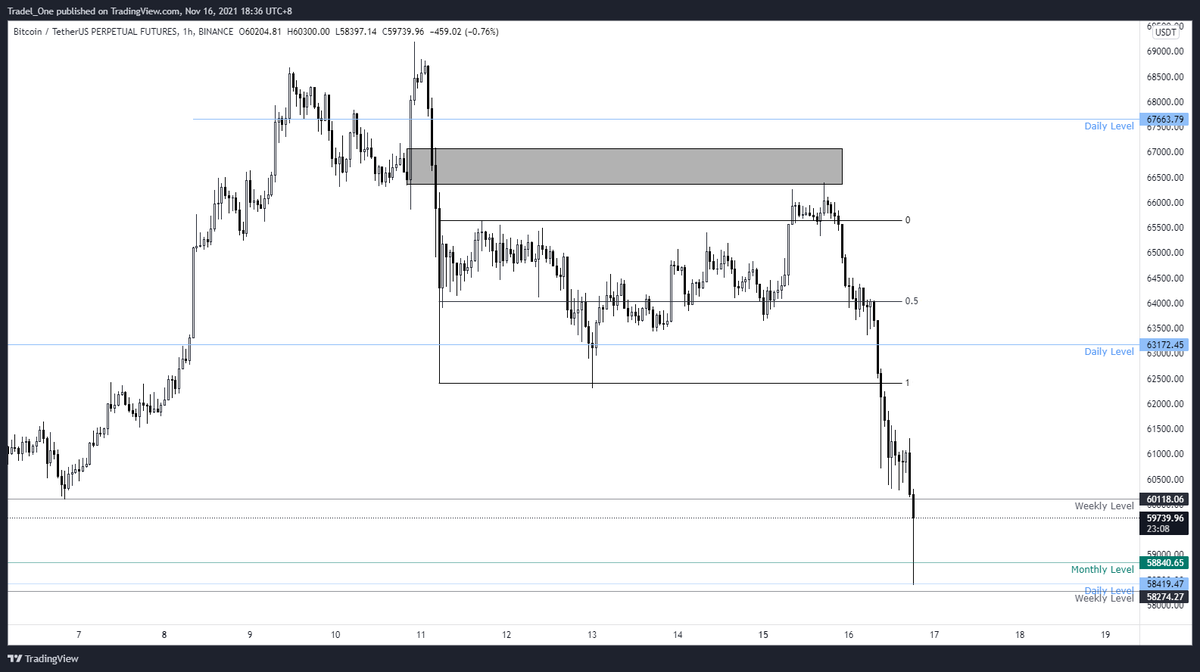
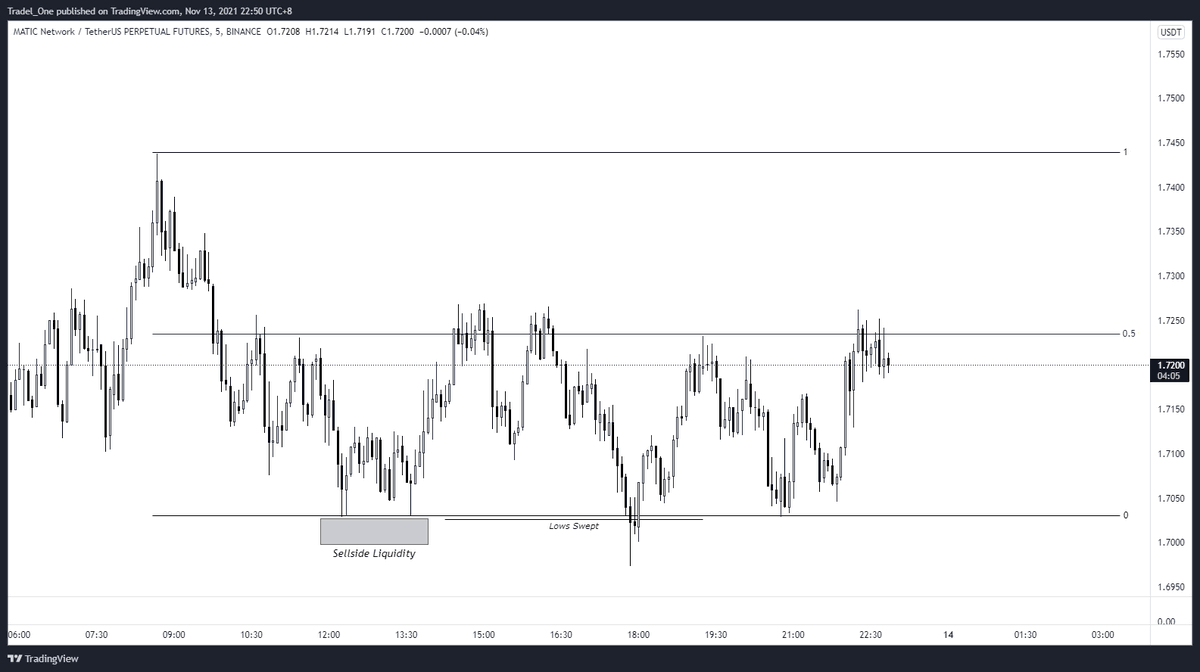
Range:
For this range, we're using the Daily Chart, with some market structure utilised to frame ourselves, and our bias
For this range, we're using the Daily Chart, with some market structure utilised to frame ourselves, and our bias

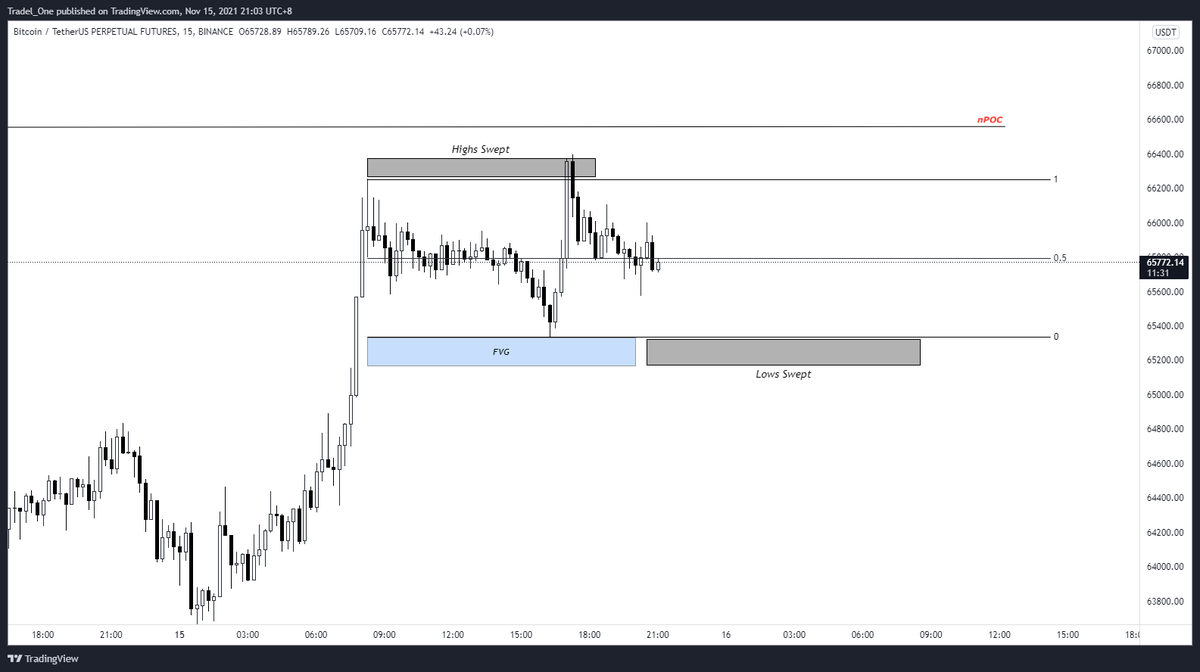
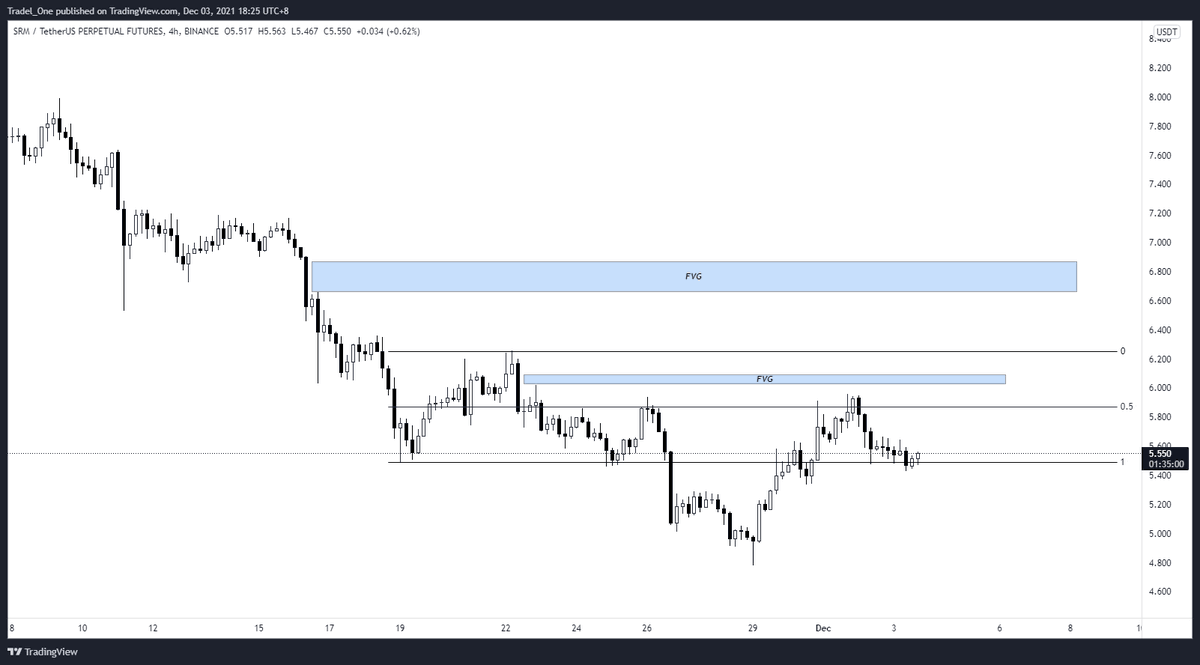
FVG's, Fair Value Gaps
What we're looking for here is where price moves away quickly from an area, leaving no corresponding candle closes between a candles body (ie wicks, or other candles).
FVG's can be used for bullish or bearish scenarios
What we're looking for here is where price moves away quickly from an area, leaving no corresponding candle closes between a candles body (ie wicks, or other candles).
FVG's can be used for bullish or bearish scenarios
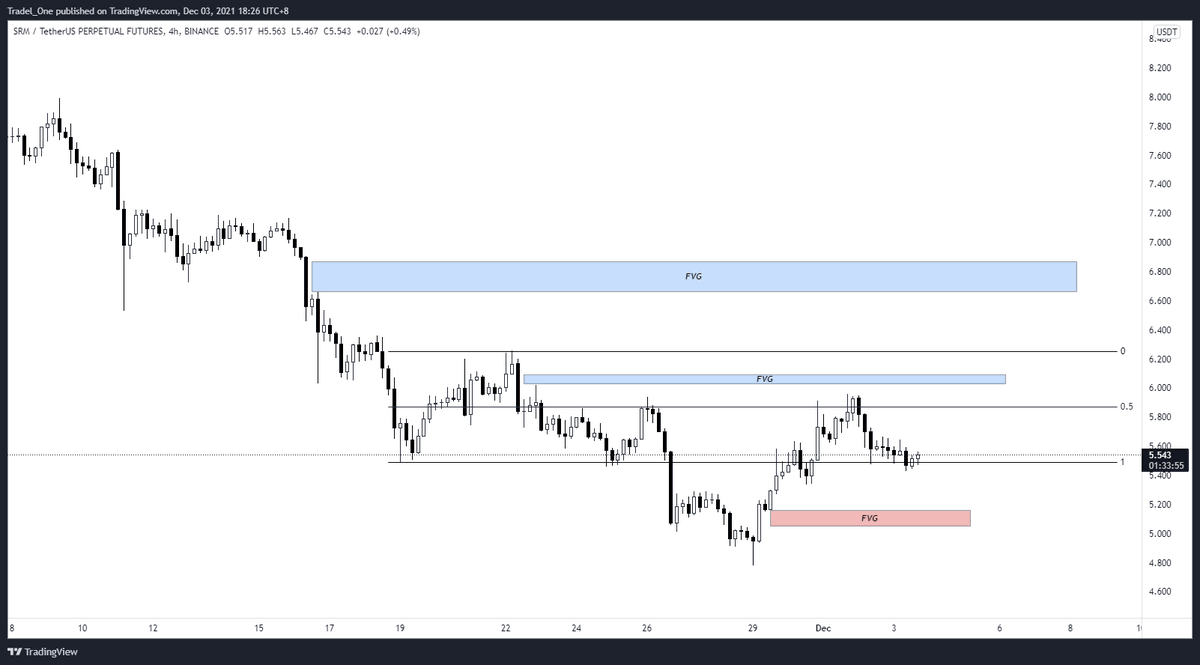
FVG's Cont'd
Beware though, as there is an FVG perched below the range too
Beware though, as there is an FVG perched below the range too
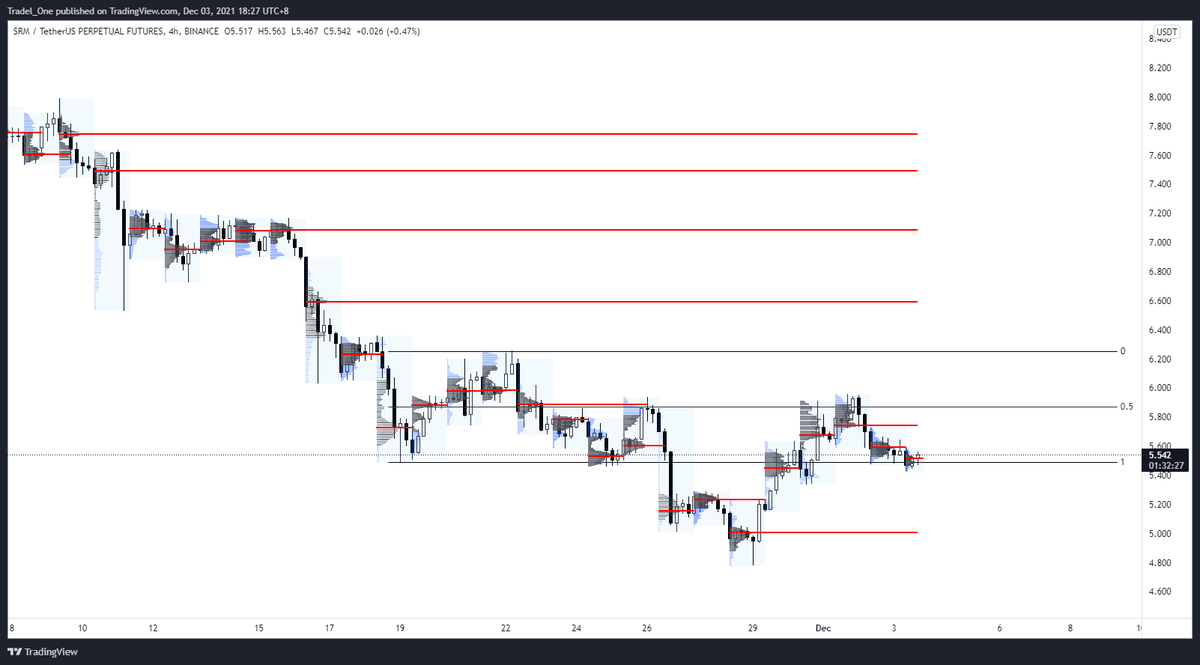
nPOC's, or Naked Points of Control
Where price has spent the most time in a given session (using the daily here on the @tradingview VPSV tool
We've got a cluster of nPOC's above us as shown by the red lines (one beneath us too)
Where price has spent the most time in a given session (using the daily here on the @tradingview VPSV tool
We've got a cluster of nPOC's above us as shown by the red lines (one beneath us too)
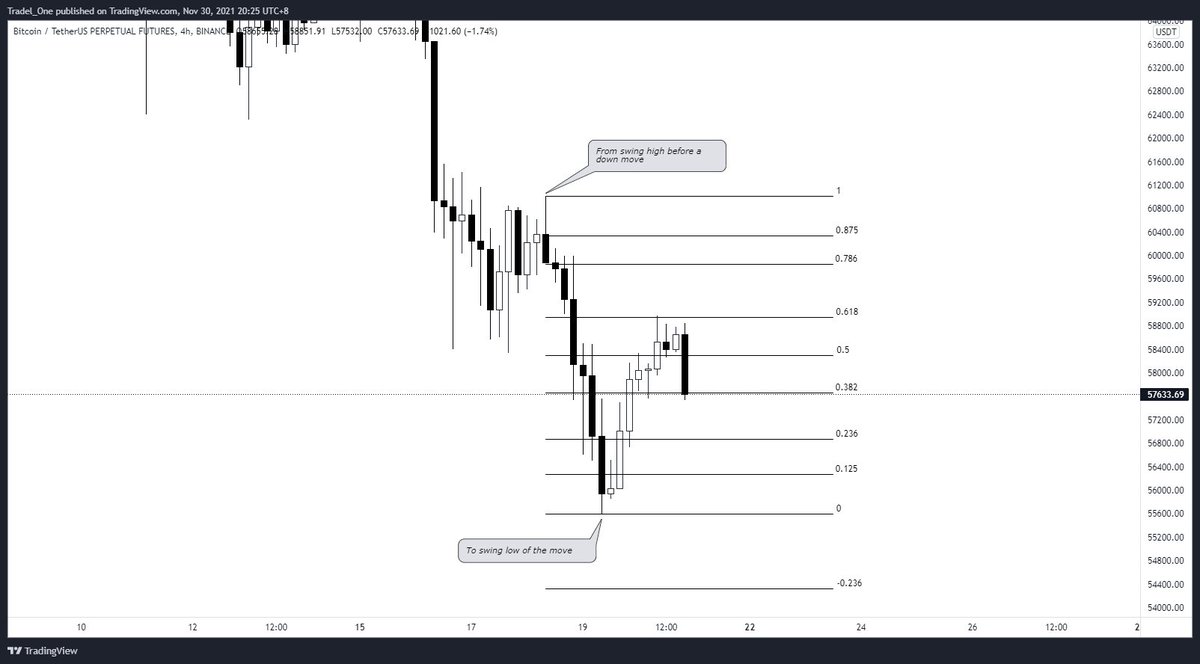
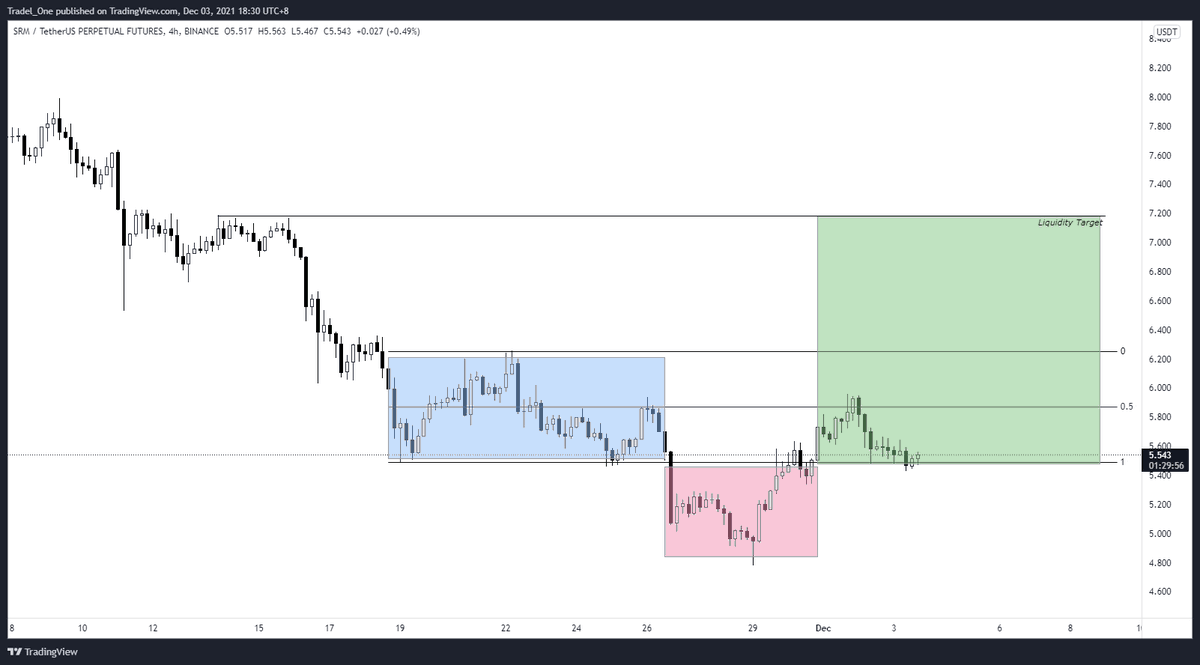
Potential PO3, Power of Three
- Accumulation (in blue)
- Manipulation (red)
- Distribution (green)
Price trades at a certain level, is pushed down to where liquidity lies, and then taken to the next untapped liquidity zone.
- Accumulation (in blue)
- Manipulation (red)
- Distribution (green)
Price trades at a certain level, is pushed down to where liquidity lies, and then taken to the next untapped liquidity zone.
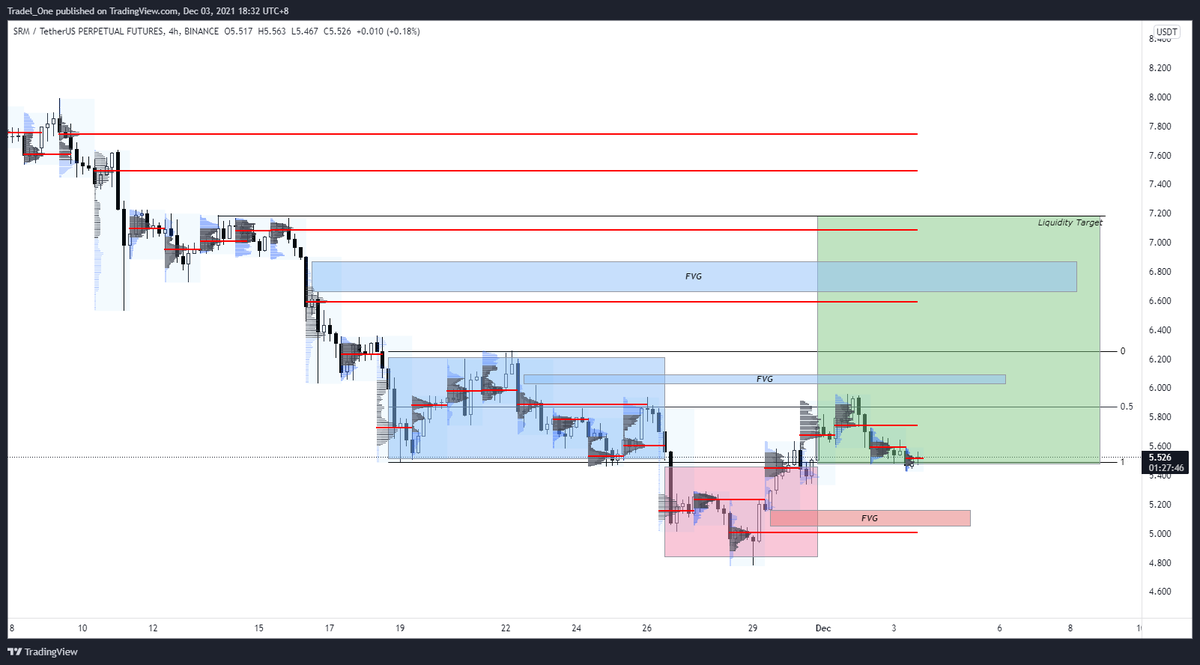
Putting it all together
Pardon the technicolour 80's rave below, but this is to show how our factors of confluence could line up to give some take profit levels at FVG's, or nPOC's etc
Completely up to you of course.
Price loves to run to liquidity, use this to your advantage
Pardon the technicolour 80's rave below, but this is to show how our factors of confluence could line up to give some take profit levels at FVG's, or nPOC's etc
Completely up to you of course.
Price loves to run to liquidity, use this to your advantage
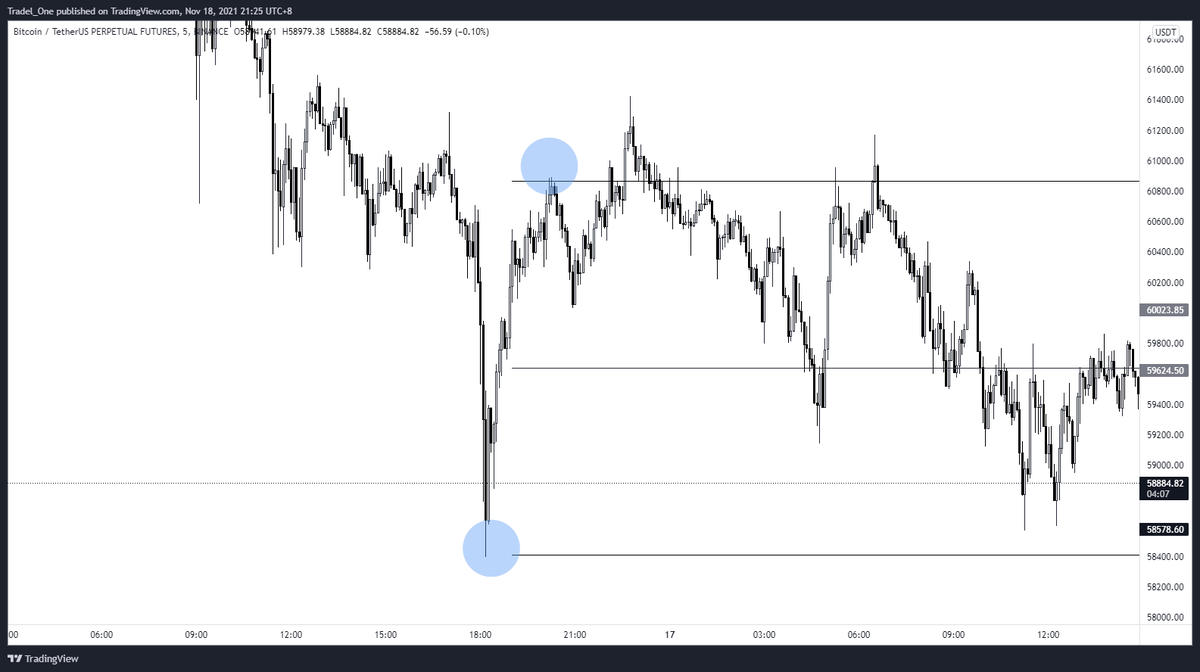
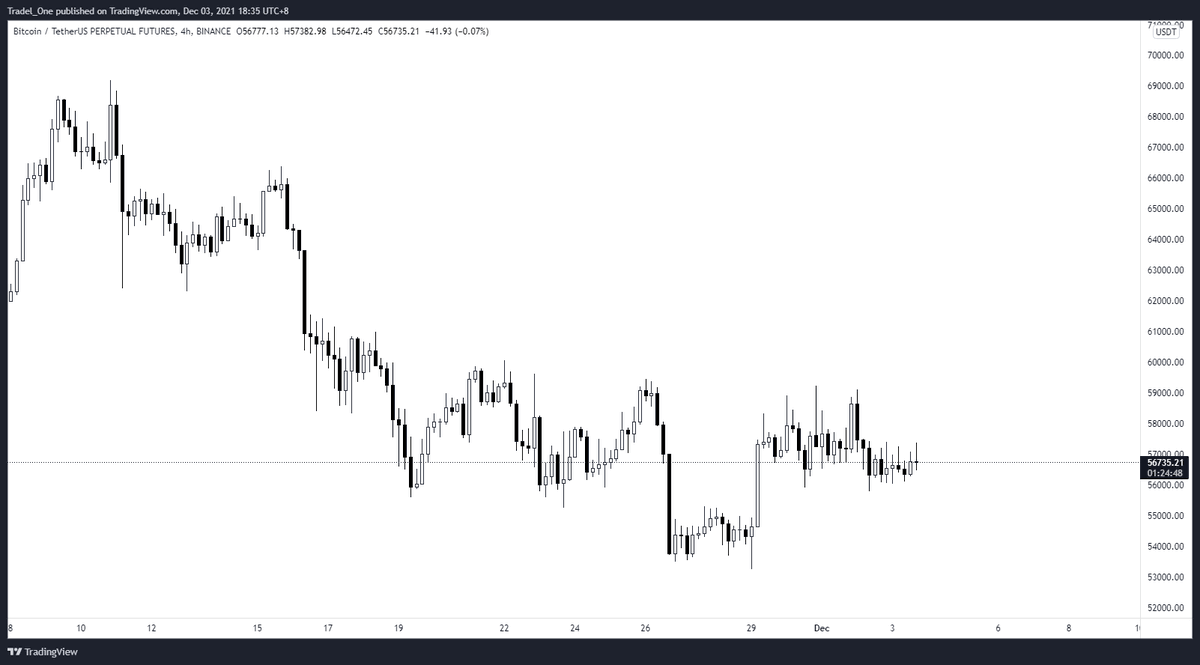
$BTC behaving itself
With Bitcoin ranging at the moment, we need to be very careful with how the cards are played.
If entry is made, you've got to keep an eye on the king.
If BTC ranges for a bit, this could play out well, but this needs some time.
With Bitcoin ranging at the moment, we need to be very careful with how the cards are played.
If entry is made, you've got to keep an eye on the king.
If BTC ranges for a bit, this could play out well, but this needs some time.
If this has helped you understand the nuances of PA a little bit more, or to be more specific, framing a PA trade, please feel free to share.
No stress or obligation though, just do what you can with the info and education.
Have a good WE, keep learning, and stay hungry!
🤝💪
No stress or obligation though, just do what you can with the info and education.
Have a good WE, keep learning, and stay hungry!
🤝💪
• • •
Missing some Tweet in this thread? You can try to
force a refresh