Alright guys, a head spinner from Module 4, Ranges & Targets:
As price is fractal in nature, we can work out a ratio from our Timeframe Based Range setup, to a workable timeframe to manage a $BTC #bitcoin trade on
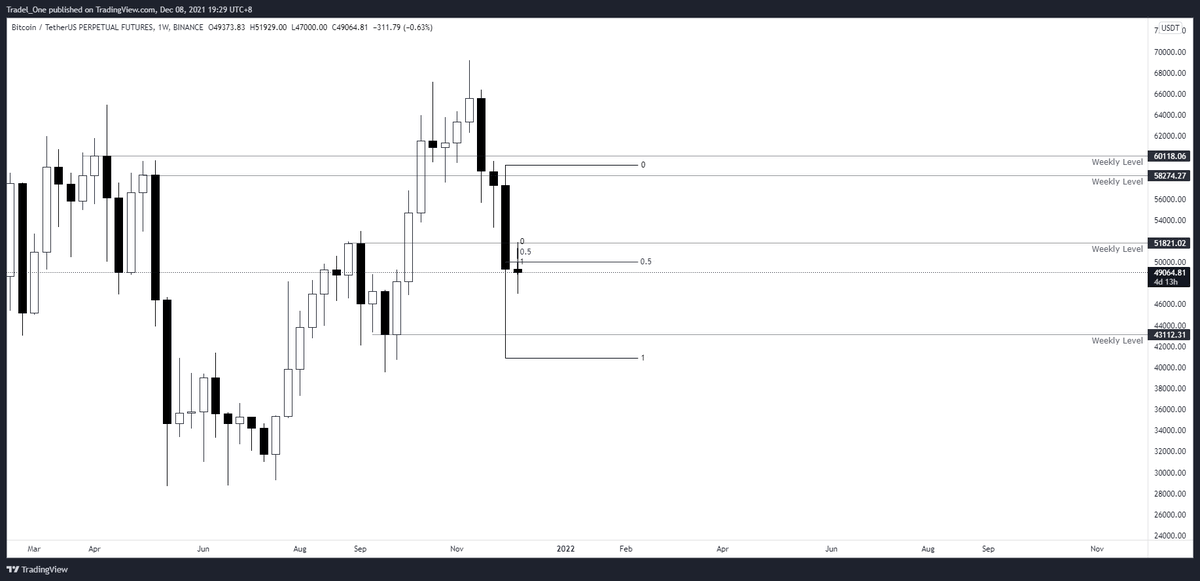
Here we set up a range on the 1D, but manage on the 15M
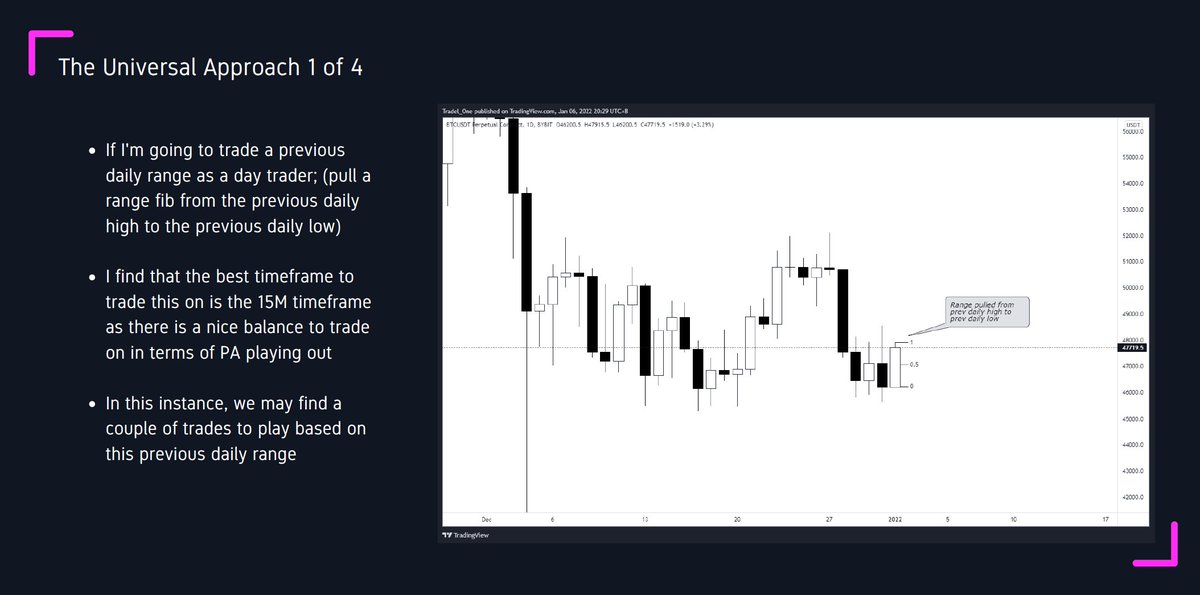
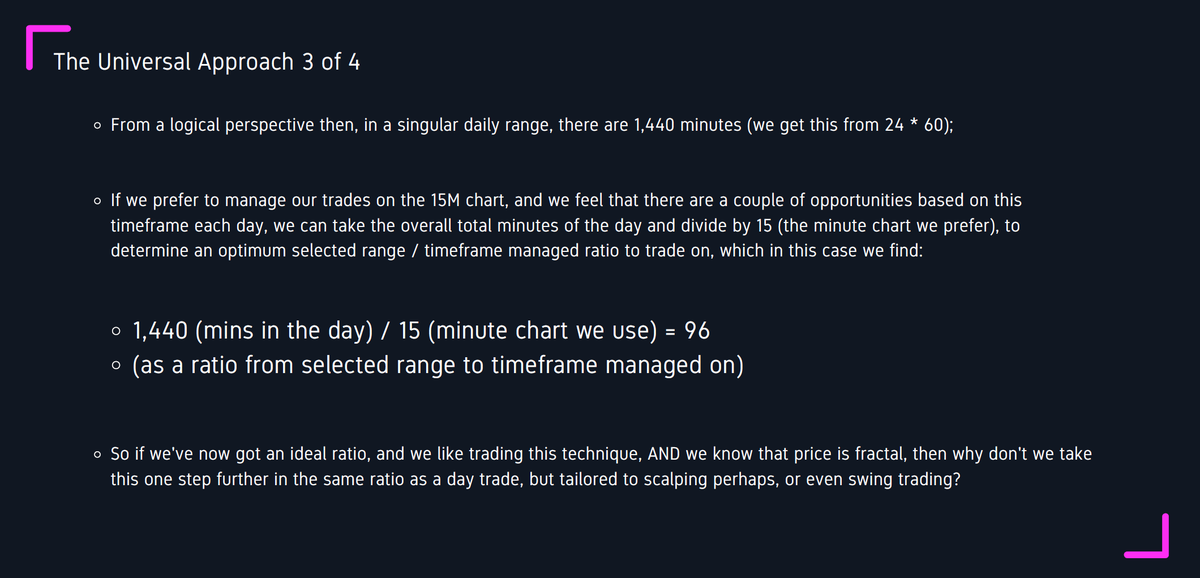
As price is fractal in nature, if we work out a ratio of TF used to establish a range, to TF used to manage a trade, we get 96 (1,440 mins in a day / 15mins)
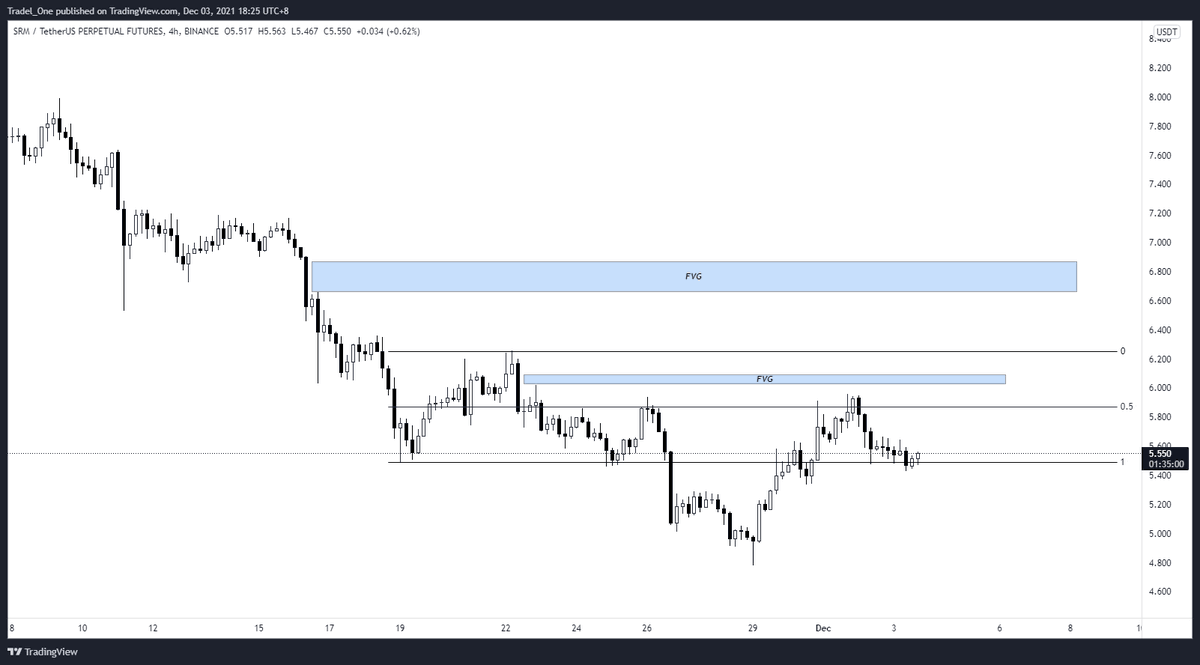
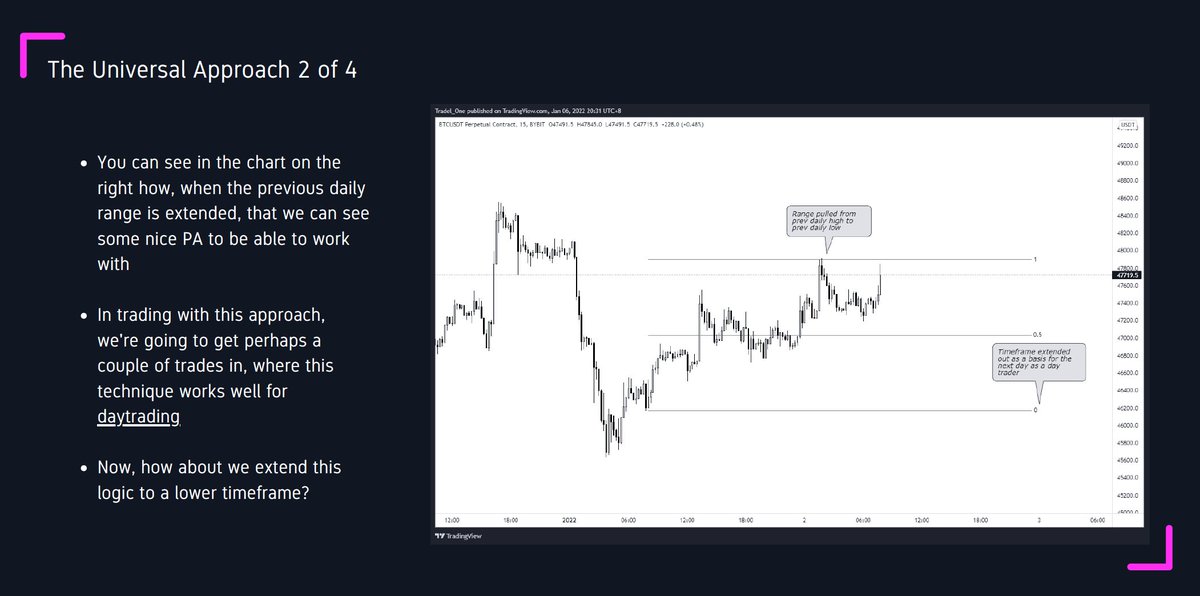
Using this logic, we can then trade a range on any timeframe based on this ratio, from scalping to swing trading
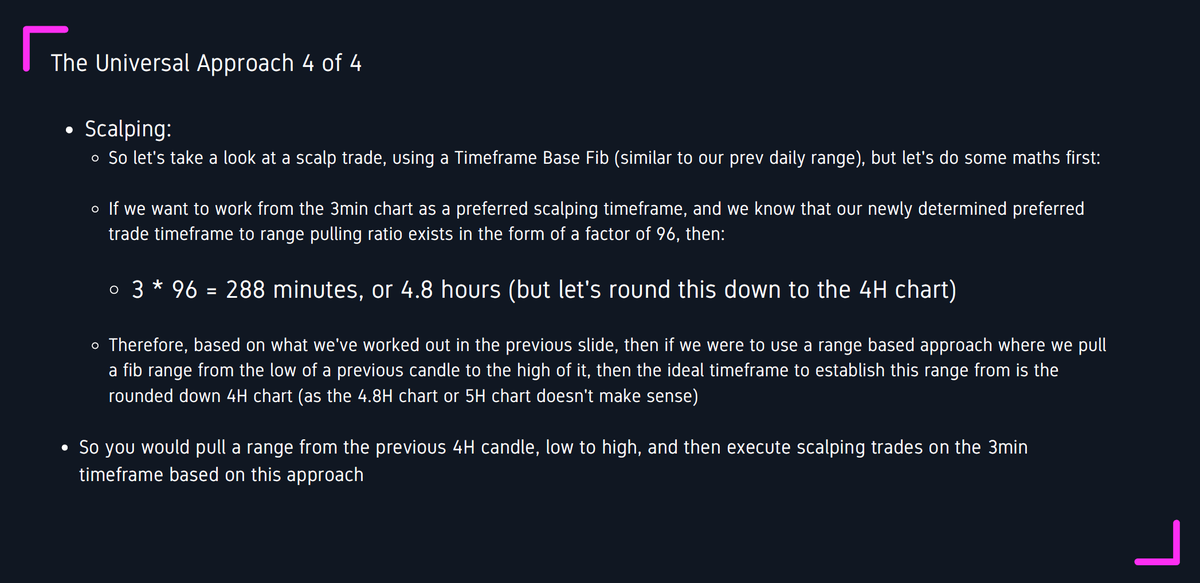
You can essentially use exactly the same technique (that we are learning), on a ratio'd timeframe of established range to a timeframe that you manage your trade on, that suits your style or the PA that is presenting
(ie daytrading set up not presenting, but scalping looks good)
So it's a bit of a head scratcher at the start, but when you delve into it, the technique we're learning truly affords you the opportunity to use it whether you are scalping, day trading, swing trading, or even position trading.
We'll learn more about this soon with eg's
🤝🍻
• • •
Missing some Tweet in this thread? You can try to
force a refresh
I mean, this isn't like the course is the best thing since sliced bread, but I would like to acknowledge a few people out of respect, motivation, & for those who inspired me
-The 2017/18 market:
Without you I wouldn't be here now after having my arse kicked by you!
Your videos and educational content are what set me off down the rabbit hole of learning how to trade, which I've used greatly as inspiration for this course, and I am forever appreciative of your influence on not only me, but many others as well
- Overall
- Value Area Trading (VAT)
- FRPV
- FVG
- Trend Reversal
- Conclusion
(this is a bit of a sneakpeek into VAT that I'll be sharing in my free course that releases in the new year that you can use on any #Crypto or #cryptocurrency
Overall:
BTC has been in a range (to a certain extent) since the start of December (some call it diagonal, I call it a series of ranges within a range)
We're now seeing some MSB to the upside, which *could* signify a trend reversal...but, let's keep reading first
VAT
Did you know that if you turn off the price of the ticker that you're observing, and then turn on VPSV, you can get a clear view of Volume Profile Session Volume?
This is really handy without the noise of price on the chart for determining poor lows and highs etc
You've no doubt asked yourself this so many times, but how can you personally define this in recognising where you have an edge?
There's a few ways that aren't reliant on immediate data that this mini- thread can hopefully help with:
Risk Management:
If you're following the practice that I shared and learnt from ICT, then you're already ahead. See below:
- Risk 1% max at a time;
- If you lose 4 trades in a row, cut to 0.5% risk
- Don't graduate back to 1% until you recover half of the losses at 1%
Risk Management Cont'd
- If you lose another four trades, then cut risk to 0.25%
- Graduate back up to 0.5% when you recover half your losses experienced at 0.5%
- Then graduate back to 1%, again, when you recover half the losses at 1%
Did a poll in my TG Group - and PA was what people wanted to see most, so:
Let's take a look at $SRM
Agenda:
- Range
- FVG's
- nPOC's
- Potential PO3
- Putting it all together
- $BTC and behaving itself
Range:
For this range, we're using the Daily Chart, with some market structure utilised to frame ourselves, and our bias
FVG's, Fair Value Gaps
What we're looking for here is where price moves away quickly from an area, leaving no corresponding candle closes between a candles body (ie wicks, or other candles).
FVG's can be used for bullish or bearish scenarios