Some observations on $BTC #Bitcoin:
- Overall
- Value Area Trading (VAT)
- FRPV
- FVG
- Trend Reversal
- Conclusion
(this is a bit of a sneakpeek into VAT that I'll be sharing in my free course that releases in the new year that you can use on any #Crypto or #cryptocurrency
- Overall
- Value Area Trading (VAT)
- FRPV
- FVG
- Trend Reversal
- Conclusion
(this is a bit of a sneakpeek into VAT that I'll be sharing in my free course that releases in the new year that you can use on any #Crypto or #cryptocurrency

Overall:
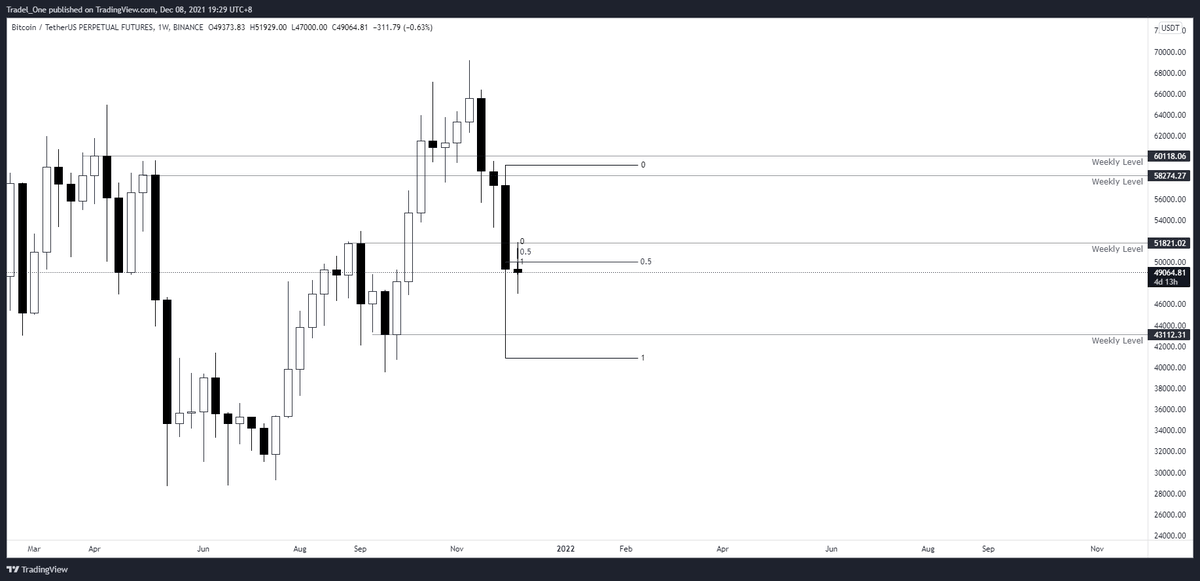
BTC has been in a range (to a certain extent) since the start of December (some call it diagonal, I call it a series of ranges within a range)
We're now seeing some MSB to the upside, which *could* signify a trend reversal...but, let's keep reading first
BTC has been in a range (to a certain extent) since the start of December (some call it diagonal, I call it a series of ranges within a range)
We're now seeing some MSB to the upside, which *could* signify a trend reversal...but, let's keep reading first

VAT
Did you know that if you turn off the price of the ticker that you're observing, and then turn on VPSV, you can get a clear view of Volume Profile Session Volume?
This is really handy without the noise of price on the chart for determining poor lows and highs etc
Did you know that if you turn off the price of the ticker that you're observing, and then turn on VPSV, you can get a clear view of Volume Profile Session Volume?
This is really handy without the noise of price on the chart for determining poor lows and highs etc


VAT Cont'd
With VAT, the grey area on my chart shows where price spent 70% of the session (each day), the remaining area is the other 30%, shown either side of the grey area
If the other 30% (blue lines) are short in length vs grey, it means that price spent little time there
With VAT, the grey area on my chart shows where price spent 70% of the session (each day), the remaining area is the other 30%, shown either side of the grey area
If the other 30% (blue lines) are short in length vs grey, it means that price spent little time there
If we see really short blue lines vs grey lines above or below the Value Area (remember, where 70% of trading volume occured during the session), then we can classify these as poor highs or poor lows.
See below in red boxes
See below in red boxes

Notice though how each of these red boxes are 'filled' if you will - shown here with a green box
Now, what we can see is that we've experienced a poor low in terms of VAT, based on the sudden movement up with $BTC, and based on the images shown, this area could look to be filled
Now, what we can see is that we've experienced a poor low in terms of VAT, based on the sudden movement up with $BTC, and based on the images shown, this area could look to be filled

VAT & FRPV
Now that we've investigated the VPSV to show how areas can be filled, let's check out the FRPV based on where price is currently trading, I've pulled the FRPV to the areas shown in blue boxes
We'll keep the VPSV shown for a sec here
Now that we've investigated the VPSV to show how areas can be filled, let's check out the FRPV based on where price is currently trading, I've pulled the FRPV to the areas shown in blue boxes
We'll keep the VPSV shown for a sec here


FRPV & VPSV
Note the first image as the FRVP pulled as previously shown
Note the second image shows the VPSV
Note the first image as the FRVP pulled as previously shown
Note the second image shows the VPSV


Price & FRVP, VPSV
Now, look at how price respects the FRVP VAH & VAL's, and we are also trading right around the POC of the FRVP as well
Note that we're at the VAH now, close to POC, and have a poor low below us.....
Now, look at how price respects the FRVP VAH & VAL's, and we are also trading right around the POC of the FRVP as well
Note that we're at the VAH now, close to POC, and have a poor low below us.....

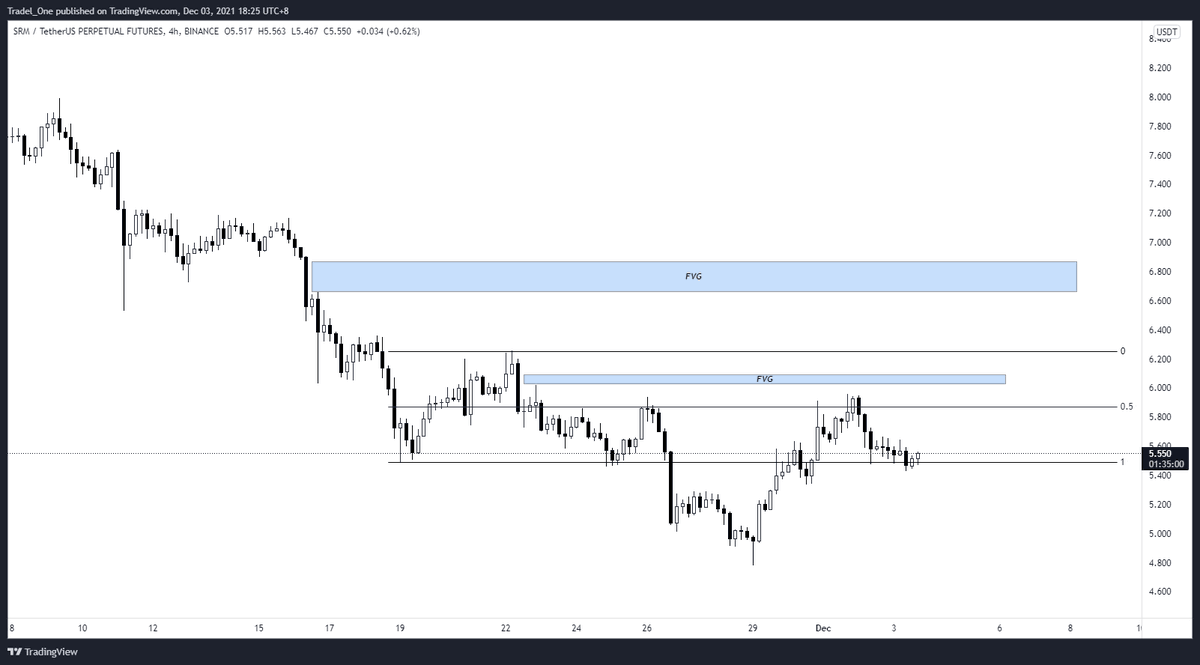
Fair Value Gap
Where price moves quickly in one direction without the interaction of a wick or body of an opposing candle to 'close' the area
Shown in red are FVG's that have been closed. In blue are the open FVG's
You can see that price fills these gaps.
Where price moves quickly in one direction without the interaction of a wick or body of an opposing candle to 'close' the area
Shown in red are FVG's that have been closed. In blue are the open FVG's
You can see that price fills these gaps.

Trend Reversal
Now that we've experienced a MSB to the upside, per my handy sketch I made in the first image, we could expect a retest of support / demand / orderblock before running higher.
Now that we've experienced a MSB to the upside, per my handy sketch I made in the first image, we could expect a retest of support / demand / orderblock before running higher.


Conclusion
When we compare poor lows, FVG's, VAH's, POC's , trend reversal play outs, & general price action concepts into the mix, you can see that blindly longing into resistance and against PA principles isn't the best option (and santa is watching)
When we compare poor lows, FVG's, VAH's, POC's , trend reversal play outs, & general price action concepts into the mix, you can see that blindly longing into resistance and against PA principles isn't the best option (and santa is watching)
Hopefully this has helped you frame your own trading a bit better from a logical approach / standpoint.
I'm not saying you don't already have a logical approach, but this is how I approach the situations presented to me
Cheers guys - say hi to the old chook for me!
🤝🍻
I'm not saying you don't already have a logical approach, but this is how I approach the situations presented to me
Cheers guys - say hi to the old chook for me!
🤝🍻
• • •
Missing some Tweet in this thread? You can try to
force a refresh