[Thread] 1. When will SA's #Omicron wave end?
@ProfAbdoolKarim:
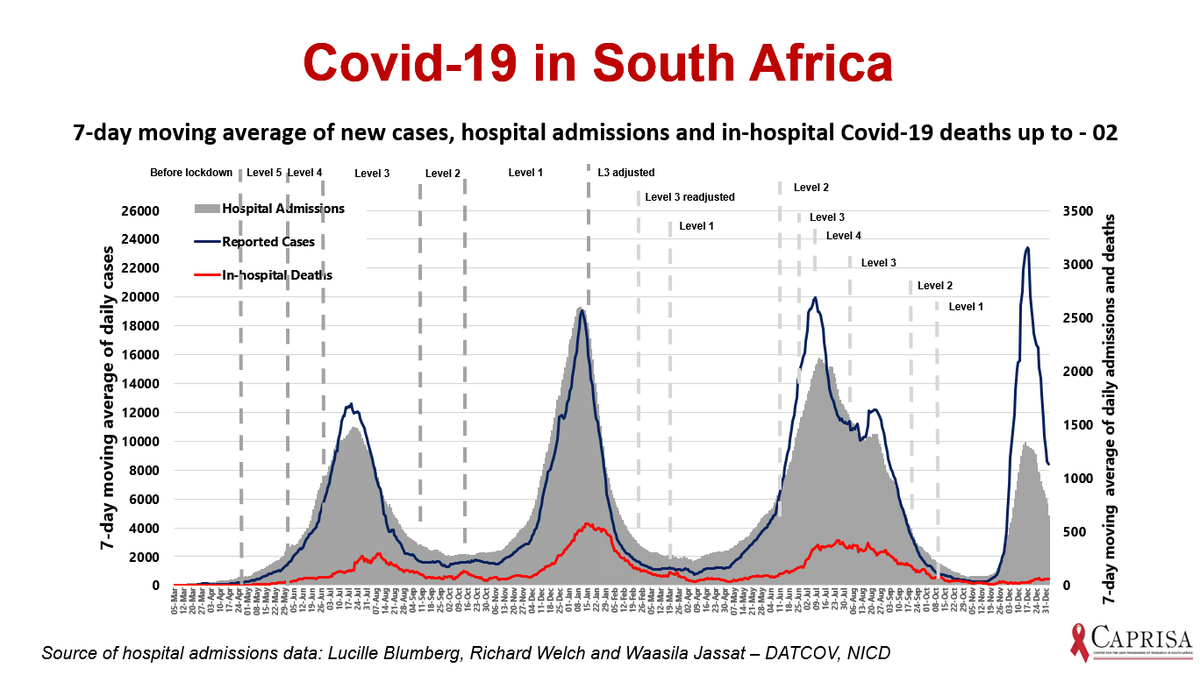
1. If cases continue 2 decline @ the current rate, the wave will end in +/- 10-11 days
2. How will we know it's the end?
@nicd_sa uses 30 cases/100,000 in the past 7 days for the beginning/end of a wave
@ProfAbdoolKarim:
1. If cases continue 2 decline @ the current rate, the wave will end in +/- 10-11 days
2. How will we know it's the end?
@nicd_sa uses 30 cases/100,000 in the past 7 days for the beginning/end of a wave

2. If the #Omicron wave does end in +/-10-11 days, it will have been just over half the length of previous waves:
1. Wave 1, 2, 3: About 75 days long
2. Wave 4 (Omicron) likely to be 40-50 days long
1. Wave 1, 2, 3: About 75 days long
2. Wave 4 (Omicron) likely to be 40-50 days long
3. Can SA expect a next #COVID19 wave?
@ProfAbdoolKarim:
1. Given the consistent 3 month gap we get in SA between waves, the 5th wave can be expected, if it is going to occur, in May this year
2. Of course, a new variant may throw this estimation out the window
@ProfAbdoolKarim:
1. Given the consistent 3 month gap we get in SA between waves, the 5th wave can be expected, if it is going to occur, in May this year
2. Of course, a new variant may throw this estimation out the window
4. How #Omicron took over: What proportion of genomes sequenced in SA = #Omicron?
1. December (latest data): 98.4%
2. November: 82.5% (#Delta = 13%)
3. October: 0.26% (Delta = 84.6%)
Source: bit.ly/3qNhoKE
1. December (latest data): 98.4%
2. November: 82.5% (#Delta = 13%)
3. October: 0.26% (Delta = 84.6%)
Source: bit.ly/3qNhoKE

5. What's SA's #COVID19 reproduction rate (how many other people 1 infected person = likely 2 infect)?
By Jan 2, the R value had declined from about 2.2 at the peak of the #Omicron wave to =+/- 0.8 (below 1 = good)
@nicd_sa R reports (up to 21 Dec): bit.ly/3G7BmGK
By Jan 2, the R value had declined from about 2.2 at the peak of the #Omicron wave to =+/- 0.8 (below 1 = good)
@nicd_sa R reports (up to 21 Dec): bit.ly/3G7BmGK

6. What's happening with #Omicron hospitalisations?
1. Past 14 days (up until Jan 1):
- Daily admissions decreased in all provinces except for EC, NC, WC
2. Past 7 days (up until Jan1):
- Admissions declined in all provinces
@nicd_sa hospital report: bit.ly/3qRLj4A

1. Past 14 days (up until Jan 1):
- Daily admissions decreased in all provinces except for EC, NC, WC
2. Past 7 days (up until Jan1):
- Admissions declined in all provinces
@nicd_sa hospital report: bit.ly/3qRLj4A


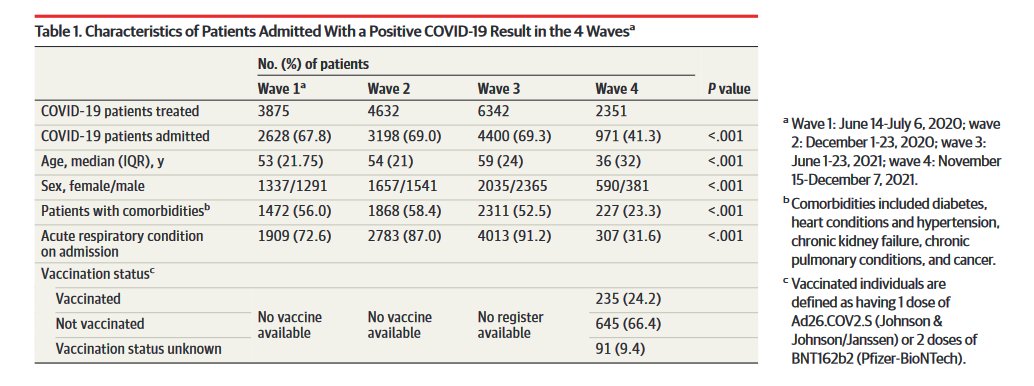
7. @Netcare_Limited (private hospital group with 49 hospitals) published hospital admission stats in JAMA for the 1st 3 weeks of Wave 4 (#Omicron) and compared it to similar periods of Wave 1 (ancestral), 2 (Beta), 3 (#Delta): bit.ly/3G6mV5s
8. Netcare study:
1. % of #COVID19 patients presenting @ emergency rooms = admitted: 68-69% (Wave 1,2,3) vs 41% (Wave 4)
2. % of patients with acute respiratory conditions @ admission: 72-91% (Wave 1,2,3) vs 31% (Wave 4)
3. Admissions (Wave 4):
- Vaxxed: 24%
- Unvaxxed : 66%
1. % of #COVID19 patients presenting @ emergency rooms = admitted: 68-69% (Wave 1,2,3) vs 41% (Wave 4)
2. % of patients with acute respiratory conditions @ admission: 72-91% (Wave 1,2,3) vs 31% (Wave 4)
3. Admissions (Wave 4):
- Vaxxed: 24%
- Unvaxxed : 66%
9. Netcare study:
1. % of #COVID19 admissions needing oxygen: 74 - 82% (Wave 1,2,3) vs 17% (Wave 4)
2. % of #COVID admissions needing ventilation: 8-16% (Wave 1,2,3) vs. 1.6% (Wave 4)
1. % of #COVID19 admissions needing oxygen: 74 - 82% (Wave 1,2,3) vs 17% (Wave 4)
2. % of #COVID admissions needing ventilation: 8-16% (Wave 1,2,3) vs. 1.6% (Wave 4)

10. Netcare study:
1. % of #COVID19 hospitalisations admitted to ICU: 30-42% (Wave 1,2,3) vs 18% (Wave 4)
2. Length of stay: 8-9 days (Wave 1,2,3) vs 3 days (Wave 4)
3. Deaths: 20-29% (Wave 1,2,3) vs 2.7% (Wave 4)
1. % of #COVID19 hospitalisations admitted to ICU: 30-42% (Wave 1,2,3) vs 18% (Wave 4)
2. Length of stay: 8-9 days (Wave 1,2,3) vs 3 days (Wave 4)
3. Deaths: 20-29% (Wave 1,2,3) vs 2.7% (Wave 4)

11. Does Netcare's data line up with admission data from other SA studies?
Yes:
1. This Lancet preprint also found smaller % of Omicron patients got admitted and they got less sick:
2. @nicd_sa data shows similar trends:
Yes:
1. This Lancet preprint also found smaller % of Omicron patients got admitted and they got less sick:
https://twitter.com/miamalan/status/1476535934359326723
2. @nicd_sa data shows similar trends:
https://twitter.com/miamalan/status/1473635481397215236
12. Have #Omicron hospitalisations peaked? (thanks @Dr_Groome + @tomtom_m 4 helping me with this):
1. Likely yes, because of the sustained decline in the 7 day moving average
2. But we need to wait another week or so to be sure. Why? (answer in next tweet)
1. Likely yes, because of the sustained decline in the 7 day moving average
2. But we need to wait another week or so to be sure. Why? (answer in next tweet)
13. Why do we need 2 wait another week or so 2 be sure that SA's #Omicron's hospitalisations have peaked? (so far, we've got data up until 1 Jan)
1. There are delays with the reporting of data
2. Right now, more 50+ people (who are more likely to be hospitalised) = testing +
1. There are delays with the reporting of data
2. Right now, more 50+ people (who are more likely to be hospitalised) = testing +

14. What's happening with #Omicron deaths?
1. Past 14 days:
- Daily deaths increased in all provinces
2. Past 7 days:
- Daily deaths decreased in all provinces except EC, FS, WC (biggest dip = GP, where SA's outbreak started + most time = lapsed since the start of infections)

1. Past 14 days:
- Daily deaths increased in all provinces
2. Past 7 days:
- Daily deaths decreased in all provinces except EC, FS, WC (biggest dip = GP, where SA's outbreak started + most time = lapsed since the start of infections)


15. In SA, trends in excess deaths are reassuring. We're not seeing the large rises in excess deaths during the #Omicron wave like we saw in past waves.
For excellent analysis on excess deaths via @tomtom_m: bit.ly/3F7IHoa
For excellent analysis on excess deaths via @tomtom_m: bit.ly/3F7IHoa

16. SA's data, so far, shows:
- The numbers of #Omicron hospitalisations + deaths = lower than in Wave 1,2,3
- The decrease in deaths (for #Omicron, compared to other waves) = more dramatic than the decline in admissions
- The numbers of #Omicron hospitalisations + deaths = lower than in Wave 1,2,3
- The decrease in deaths (for #Omicron, compared to other waves) = more dramatic than the decline in admissions
https://twitter.com/tomtom_m/status/1478795238978248713
17. Why is #Omicron leading 2 milder disease?
@ProfAbdoolKarim:
1. We have accumulating evidence that shows Omicron causes little lung infection, so respiratory distress/multi-organ disease = uncommon
2. The main reason 4 the lower severity seems 2 be a less virulent virus
@ProfAbdoolKarim:
1. We have accumulating evidence that shows Omicron causes little lung infection, so respiratory distress/multi-organ disease = uncommon
2. The main reason 4 the lower severity seems 2 be a less virulent virus
18. Studies that show #Omicron may cause less severe disease than other variants as infection is mostly confined to the upper airway (nose, throat, windpipe) and therefore causes less damage 2 the lungs via @EricTopol.
Eric Topol's original tweet: bit.ly/32TF5t9
Eric Topol's original tweet: bit.ly/32TF5t9

19. What are the other reasons for #Omicron causing milder disease?
@ProfAbdoolKarim:
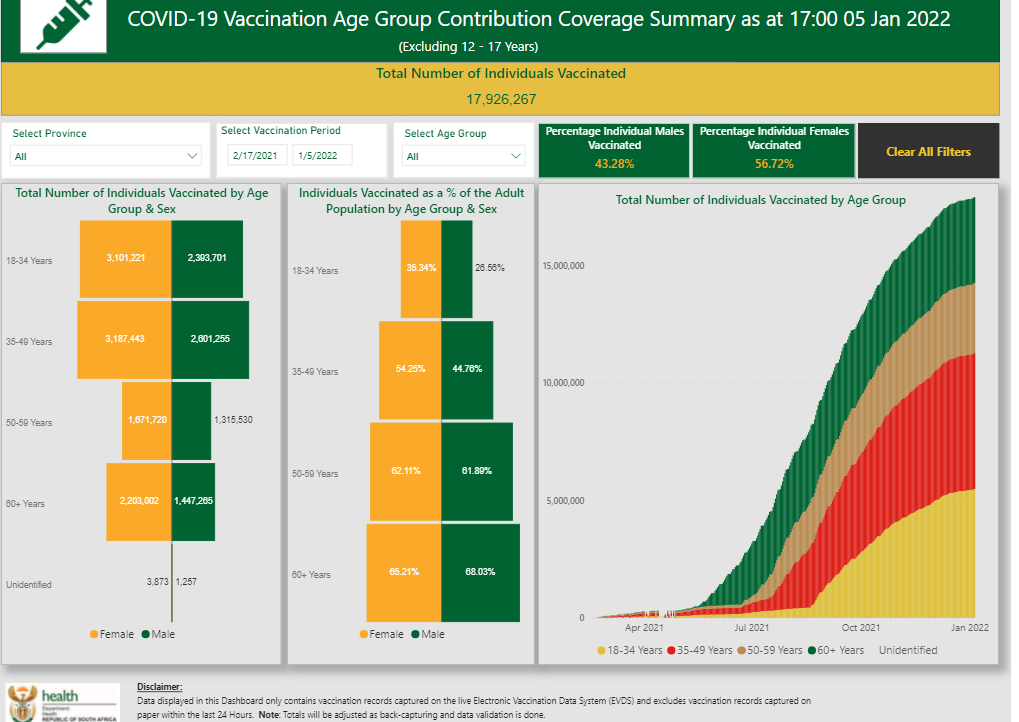
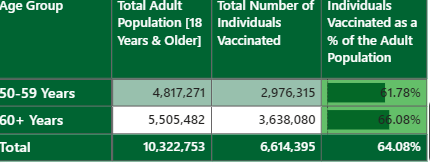
1. Vaccines show substantial impact in preventing severe disease (without boosters)
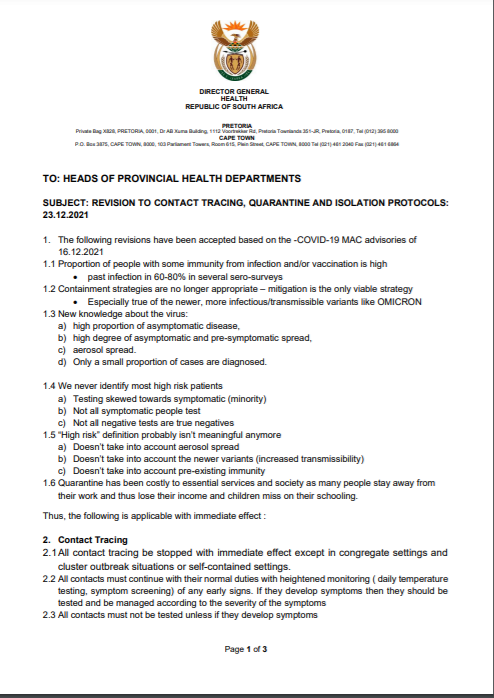
2. Prior natural immunity may also be making some contribution (SA's natural immunity = between 60-80%).
@ProfAbdoolKarim:
1. Vaccines show substantial impact in preventing severe disease (without boosters)
2. Prior natural immunity may also be making some contribution (SA's natural immunity = between 60-80%).
Here are the tables with the names of the provinces, I accidentally cut off the names when I cropped the images: 


• • •
Missing some Tweet in this thread? You can try to
force a refresh


