Why You're Very Likely to Become A Millionaire in Data Science or Machine Learning
🧵[1/n]
#datascience #jobs #money #machinelearning
🧵[1/n]
#datascience #jobs #money #machinelearning
https://twitter.com/iamRobONeill/status/1480552051146952712
[2/n]
The reasons that you're likely to become a millionaire in data science:
1. salaries are already high in 2021
2. competition for high salaries is weaker than you think
3. salaries are likely to increase in the 2020s
Let's look at each of these.
#datascience #money #jobs
The reasons that you're likely to become a millionaire in data science:
1. salaries are already high in 2021
2. competition for high salaries is weaker than you think
3. salaries are likely to increase in the 2020s
Let's look at each of these.
#datascience #money #jobs
[3/n]
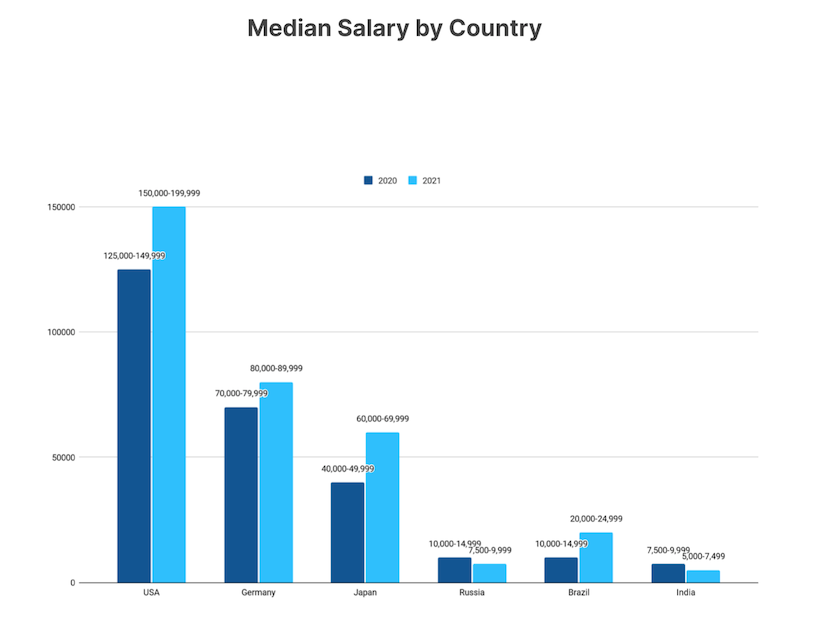
Let's start with current salaries.
According to Kaggle, the median salary for a US Data Scientist in 2021 is close to $200,000.
kaggle.com/kaggle-survey-…
#datascience #data #jobs
Let's start with current salaries.
According to Kaggle, the median salary for a US Data Scientist in 2021 is close to $200,000.
kaggle.com/kaggle-survey-…
#datascience #data #jobs
[4/n]
The above figure probably does not include stock options and stock grants, which can be very large.
The above figure probably does not include stock options and stock grants, which can be very large.
[5/n]
For example, when I worked at Apple, it was common for people to receive RSU grants (restricted stock) that could be worth many multiples of salary.
For example, when I worked at Apple, it was common for people to receive RSU grants (restricted stock) that could be worth many multiples of salary.
[6/n]
To be clear: these stock grants typically vest over 4 years ... so you need to stay with the company to get the benefit
But, the point is that an in-demand data scientist could make close to $200,000 in salary, + stock grants that could be worth hundreds of thousands.
To be clear: these stock grants typically vest over 4 years ... so you need to stay with the company to get the benefit
But, the point is that an in-demand data scientist could make close to $200,000 in salary, + stock grants that could be worth hundreds of thousands.
[7/n]
If you look at this compensation, it's easy to see how you could earn $1,000,000 as a data scientist within 5 to 10 years.
#datascience #jobs
If you look at this compensation, it's easy to see how you could earn $1,000,000 as a data scientist within 5 to 10 years.
#datascience #jobs
[8/n]
And frankly, you could get to $1,000,000 in earnings faster if you are reasonably skilled at some niche topics ... particularly more advanced forms of machine learning and AI.
#datascience #machinelearning #jobs
And frankly, you could get to $1,000,000 in earnings faster if you are reasonably skilled at some niche topics ... particularly more advanced forms of machine learning and AI.
#datascience #machinelearning #jobs
[9/n]
For example, US data scientists in roughly the top 20% can make from $200,000 to $1,000,000 *per year*
#datascience #machinelearning #jobs
For example, US data scientists in roughly the top 20% can make from $200,000 to $1,000,000 *per year*
#datascience #machinelearning #jobs

[10/n]
So if you are highly skilled ...
And you can get a job at a decent company (especially a FAANG company) ...
Then you have a good shot at making well over $200,000+ per year.
So if you are highly skilled ...
And you can get a job at a decent company (especially a FAANG company) ...
Then you have a good shot at making well over $200,000+ per year.
[11/n]
And if you're decent at managing your expenses and investing any extra cash, you should be able to get to $1M net worth within a few years
And if you're decent at managing your expenses and investing any extra cash, you should be able to get to $1M net worth within a few years
[12/n]
There are a couple of other things that I should point out:
1. your competition is lower than you think
2. salaries are likely to increase in the 2020s
#datascience #jobs
There are a couple of other things that I should point out:
1. your competition is lower than you think
2. salaries are likely to increase in the 2020s
#datascience #jobs
[13/n]
Concerning competition:
I hate to be an asshole, but most people who are competing for data science jobs are not that skilled.
I see a *lot* of data science code and at least 50% is trash.
#datascience #jobs
Concerning competition:
I hate to be an asshole, but most people who are competing for data science jobs are not that skilled.
I see a *lot* of data science code and at least 50% is trash.
#datascience #jobs
[14/n]
Even at "elite" companies, many people are mediocre.
Lots of people that I worked with at Apple were just phoning it in.
(Although, a few were exceptional.)
Even at "elite" companies, many people are mediocre.
Lots of people that I worked with at Apple were just phoning it in.
(Although, a few were exceptional.)
[15/n]
If you can become "fluent" in data science ... highly skilled and able to perform under time pressure
Then you'll do well against the other people who are competing for high paying jobs.
#datascience #jobs
If you can become "fluent" in data science ... highly skilled and able to perform under time pressure
Then you'll do well against the other people who are competing for high paying jobs.
#datascience #jobs
[16/n]
Concerning salary increases:
Due to some demographic trends (both in the US, and worldwide) ...
We're likely to see salaries increase through the 2020s.
Concerning salary increases:
Due to some demographic trends (both in the US, and worldwide) ...
We're likely to see salaries increase through the 2020s.
https://twitter.com/Josh_Ebner/status/1477092762365403142?s=20
[17/n]
To summarize: the Baby Boomer generation was large compared to more recent generations.
And the vast majority of Boomers will retire by the mid 2020s.
#jobs #economics
To summarize: the Baby Boomer generation was large compared to more recent generations.
And the vast majority of Boomers will retire by the mid 2020s.
#jobs #economics
[18/n]
As the Boomers retire, there won't be enough people to replace all of them.
This will create a labor shortage.
The labor shortage will be most acute in high-skilled domains and in management.
#Economics #jobs
As the Boomers retire, there won't be enough people to replace all of them.
This will create a labor shortage.
The labor shortage will be most acute in high-skilled domains and in management.
#Economics #jobs
[19/n]
As the supply of high-skill labor decreases, the price of high-skill labor will increase.
#Economics #jobs
As the supply of high-skill labor decreases, the price of high-skill labor will increase.
#Economics #jobs
[20/n]
So: the retirement of the Boomers in the 2020s will likely cause salaries to increase even more.
So: the retirement of the Boomers in the 2020s will likely cause salaries to increase even more.
[21/n]
Said differently:
The demographic trends are likely to cause data science salaries to increase even more in the 2020s.
Said differently:
The demographic trends are likely to cause data science salaries to increase even more in the 2020s.
[22/n]
Now to be clear: most of the data scientists that I know are Millennials and GenX.
So the retirement of the Boomers may not directly cause a data scientist shortage.
Now to be clear: most of the data scientists that I know are Millennials and GenX.
So the retirement of the Boomers may not directly cause a data scientist shortage.
[24/n]
What that means, is that older Millennials and GenX will be moved to management.
What that means, is that older Millennials and GenX will be moved to management.
[25/n]
So some of the high-skill data scientists from Millennial and GenX generations will be moved from front-line data science roles to management roles.
In turn, this will decrease the supply of data scientists, and therefore increase salaries.
#DataScience #jobs
So some of the high-skill data scientists from Millennial and GenX generations will be moved from front-line data science roles to management roles.
In turn, this will decrease the supply of data scientists, and therefore increase salaries.
#DataScience #jobs
[26/30]
So, data science salaries are already high, and demographic trends are likely to push them even higher in the 2020s.
... particularly for the highest-skilled individuals.
So, data science salaries are already high, and demographic trends are likely to push them even higher in the 2020s.
... particularly for the highest-skilled individuals.
[27/30]
Let's recap:
You're likely to become a millionaire in data science because:
1. salaries are already high in 2021
2. competition for high salaries is weaker than you think
3. salaries are likely to increase in the 2020s
Let's recap:
You're likely to become a millionaire in data science because:
1. salaries are already high in 2021
2. competition for high salaries is weaker than you think
3. salaries are likely to increase in the 2020s
[28/30]
If you want to maximize your probability of reaching $1 million in data science, here's what I recommend:
1. Practice data science so you are highly skilled
2. Get into the top 50%, then top 20%, then top 5%
3. Build a network, so you have access to the best jobs
If you want to maximize your probability of reaching $1 million in data science, here's what I recommend:
1. Practice data science so you are highly skilled
2. Get into the top 50%, then top 20%, then top 5%
3. Build a network, so you have access to the best jobs
[29/30]
Each of those topics is somewhat complex, so I'll write about them another time.
Each of those topics is somewhat complex, so I'll write about them another time.
[30/30]
If you want to master data science and make more money, then follow me here: @Josh_Ebner
Every day, I post threads and advice on how to master data science and machine learning in Python and R.
#DataScience #machinelearning #Python #rstats
If you want to master data science and make more money, then follow me here: @Josh_Ebner
Every day, I post threads and advice on how to master data science and machine learning in Python and R.
#DataScience #machinelearning #Python #rstats
• • •
Missing some Tweet in this thread? You can try to
force a refresh