[2/42]
When you do data analysis, you first need to start by clarifying objectives.
Why are you doing the analysis?
What’s the end goal? (e.g., the thing you’re trying to improve, understand, etc)
#datascience #DataAnalytics #data
When you do data analysis, you first need to start by clarifying objectives.
Why are you doing the analysis?
What’s the end goal? (e.g., the thing you’re trying to improve, understand, etc)
#datascience #DataAnalytics #data
[3/42]
To do this in a business setting, you’ll typically talk with stakeholders, business partners, and other team members who are familiar with the subject of the analysis.
To do this in a business setting, you’ll typically talk with stakeholders, business partners, and other team members who are familiar with the subject of the analysis.
[4/42]
When you do a data analysis, you need to understand what’s *driving* the analysis.
#datascience #DataAnalytics #data
When you do a data analysis, you need to understand what’s *driving* the analysis.
#datascience #DataAnalytics #data
[5/42]
There’s almost always a goal or reason (increase sales, increase customer satisfaction, decrease product defects or errors, etc)
As you do this, you will probably identify a few key metrics that are central to the analysis. That will be important later.
There’s almost always a goal or reason (increase sales, increase customer satisfaction, decrease product defects or errors, etc)
As you do this, you will probably identify a few key metrics that are central to the analysis. That will be important later.
[6/42]
Once you understand the purpose of the analysis, you need to start asking preliminary questions.
This is before you even have data!
#datascience #DataAnalytics #data
Once you understand the purpose of the analysis, you need to start asking preliminary questions.
This is before you even have data!
#datascience #DataAnalytics #data
[7/42]
When you do a data analysis, start by asking simple questions about who, what, where, and when.
#datascience #DataAnalytics #data
When you do a data analysis, start by asking simple questions about who, what, where, and when.
#datascience #DataAnalytics #data
[8/42]
For example:
– What was the overall performance, and how did it compare to the goal (assuming a goal existed)
– Which teams or individuals performed the best?
– Where was performance the best (what region, city, work site)
– When did performance change?
For example:
– What was the overall performance, and how did it compare to the goal (assuming a goal existed)
– Which teams or individuals performed the best?
– Where was performance the best (what region, city, work site)
– When did performance change?
[9/42]
Once you understand the analytical objectives and you have a set of initial questions, you need to identify the relevant data that you’ll need.
#datascience #DataAnalytics #data
Once you understand the analytical objectives and you have a set of initial questions, you need to identify the relevant data that you’ll need.
#datascience #DataAnalytics #data
[10/42]
If you want to understand sales, then you’ll obviously need “sales” data.
And you’ll need other variables that will help you filter and slice your data.
If you want to understand sales, then you’ll obviously need “sales” data.
And you’ll need other variables that will help you filter and slice your data.
[11/42]
So, if you are curious about sales performance by *team*, you’ll need team level data (which will probably include a “team” categorical variable.
So, if you are curious about sales performance by *team*, you’ll need team level data (which will probably include a “team” categorical variable.
[12/42]
If you want to know about performance by city or region, you’ll need variables for city and region.
At this stage, you’re just trying to figure out what you need.
If you want to know about performance by city or region, you’ll need variables for city and region.
At this stage, you’re just trying to figure out what you need.
[13/42]
The next step in a data analysis: you need to get the data.
Getting data can be complicated, because the various variables you need are often in different places and sometimes in different formats.
#datascience #DataAnalytics #data
The next step in a data analysis: you need to get the data.
Getting data can be complicated, because the various variables you need are often in different places and sometimes in different formats.
#datascience #DataAnalytics #data
[14/42]
For example, some data might be in a database.
Other data might be in a CSV file on someone’s computer.
For example, some data might be in a database.
Other data might be in a CSV file on someone’s computer.
[15/42]
Getting relevant data is often harder in smaller companies, because they have less budget for data warehousing and data management.
In larger companies, data warehouses tend to be larger, cleaner, more complete, and better maintained generally.
#DataAnalytics #data
Getting relevant data is often harder in smaller companies, because they have less budget for data warehousing and data management.
In larger companies, data warehouses tend to be larger, cleaner, more complete, and better maintained generally.
#DataAnalytics #data
[16/42]
Getting data often requires you to use SQL and CSV-to-dataframe tools (so it’s good to know some SQL)
#datascience #DataAnalytics #data
Getting data often requires you to use SQL and CSV-to-dataframe tools (so it’s good to know some SQL)
#datascience #DataAnalytics #data
[17/42]
The next data analysis step: you need to clean and prepare the data.
This often involves:
– dealing with missing values
– recoding categories
– reshaping datasets from wide to long format, or from long to wide (i.e., melt and pivot)
– joining multiple datasets together
The next data analysis step: you need to clean and prepare the data.
This often involves:
– dealing with missing values
– recoding categories
– reshaping datasets from wide to long format, or from long to wide (i.e., melt and pivot)
– joining multiple datasets together
[18/42]
Data preparation is complicated, and I could write thousands of words on that topic alone. So, I’ll need to explain it in depth another time.
(Although, I’ve written about it here on Twitter before)
Data preparation is complicated, and I could write thousands of words on that topic alone. So, I’ll need to explain it in depth another time.
(Although, I’ve written about it here on Twitter before)
[19/42]
Once you get to this point, you should have a working dataset that has all of the variables and data that you need to accomplish the objectives of the analysis.
Once you get to this point, you should have a working dataset that has all of the variables and data that you need to accomplish the objectives of the analysis.
[20/42]
So next, you begin to actually analyze the data using charts, graphs, and data aggregations.
#datascience #DataAnalytics #data
So next, you begin to actually analyze the data using charts, graphs, and data aggregations.
#datascience #DataAnalytics #data
[21/42]
The typical process is to start with high-level charts and graphs, and then drill down to more detailed charts and graphs later.
There’s actually a good mantra for this: “Overview first, zoom and filter, details on demand.”
#datascience #DataAnalytics #data
The typical process is to start with high-level charts and graphs, and then drill down to more detailed charts and graphs later.
There’s actually a good mantra for this: “Overview first, zoom and filter, details on demand.”
#datascience #DataAnalytics #data
[22/42]
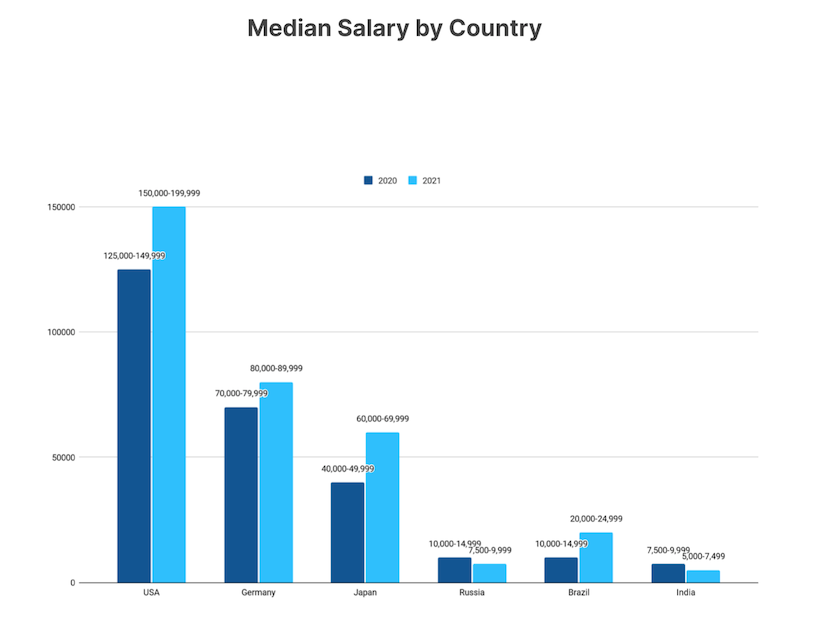
So first, you just want to get an overview of your data. That typically means plotting single variable charts like histograms & density plots, or bi-variate charts like barplots, scatterplots, etc.
Some of these initial charts may answer some questions.
#DataAnalytics
So first, you just want to get an overview of your data. That typically means plotting single variable charts like histograms & density plots, or bi-variate charts like barplots, scatterplots, etc.
Some of these initial charts may answer some questions.
#DataAnalytics
[23/42]
For example, a simple line chart of product revenue over time may show when the “sales” metric changed. That may answer an important question.
For example, a simple line chart of product revenue over time may show when the “sales” metric changed. That may answer an important question.
[24/42]
But sometimes, initial charts do not immediately show what happened.
Frequently, your initial “overview” charts are insufficient to answer your questions.
But sometimes, initial charts do not immediately show what happened.
Frequently, your initial “overview” charts are insufficient to answer your questions.
[25/42]
So, you commonly need to filter or subset your data to get more information.
And you need to create more detailed charts.
#datascience #DataAnalytics #data
So, you commonly need to filter or subset your data to get more information.
And you need to create more detailed charts.
#datascience #DataAnalytics #data
[26/42]
So instead of just using simple histograms and scatterplots, you might create small-multiple versions of those, that break those charts out by an additional variable.
Or you might filter down to a specific subset and *then* plot your data.
So instead of just using simple histograms and scatterplots, you might create small-multiple versions of those, that break those charts out by an additional variable.
Or you might filter down to a specific subset and *then* plot your data.
[27/42]
At every step of this phase of the analysis, you’re looking for:
– anything that might answer one of your initial questions
– anything else that’s strange or amiss or interesting
#datascience #DataAnalytics
At every step of this phase of the analysis, you’re looking for:
– anything that might answer one of your initial questions
– anything else that’s strange or amiss or interesting
#datascience #DataAnalytics
[28/42]
If you find something new that’s interesting, write down a note.
These things often provoke new questions that you can answer with your data. They may yield important insights or they may require broader investigation by your team.
#datascience #DataAnalytics
If you find something new that’s interesting, write down a note.
These things often provoke new questions that you can answer with your data. They may yield important insights or they may require broader investigation by your team.
#datascience #DataAnalytics
[29/42]
Again though: as you visualize, slice, and filter your data, you’re looking for things that help answer important questions, or things that would be valuable to your partners
#datascience #DataAnalytics #data
Again though: as you visualize, slice, and filter your data, you’re looking for things that help answer important questions, or things that would be valuable to your partners
#datascience #DataAnalytics #data
[30/42]
For example: “the team in Austin is under-performing, and it looks like they’re having trouble selling XYZ product in particular.”
For example: “the team in Austin is under-performing, and it looks like they’re having trouble selling XYZ product in particular.”
[31/42]
Once you’ve done all of this, the next step in a data analysis is to share your results.
#datascience #DataAnalytics #data
Once you’ve done all of this, the next step in a data analysis is to share your results.
#datascience #DataAnalytics #data
[32/42]
Initially, you’ll do this informally with your immediate managers, team members, and business partners.
This may be as simple as a 10 minute meeting where you call a person over to your desk, or it might be a 30 minute meeting to review initial findings.
Initially, you’ll do this informally with your immediate managers, team members, and business partners.
This may be as simple as a 10 minute meeting where you call a person over to your desk, or it might be a 30 minute meeting to review initial findings.
[33/42]
During these initial reviews, your partners might have new questions or raise new issues.
If that’s the case, you may need to do more work, which often requires you to go back to a previous step in the process (i.e., get more data, clean it, plot)
During these initial reviews, your partners might have new questions or raise new issues.
If that’s the case, you may need to do more work, which often requires you to go back to a previous step in the process (i.e., get more data, clean it, plot)
[34/42]
At some point though, the analytical results begin to solidify and you can package them up into a more formalized format.
In a business setting, this is almost always a PowerPoint presentation (or Keynote, if you use Apple software).
#datascience #DataAnalytics #data
At some point though, the analytical results begin to solidify and you can package them up into a more formalized format.
In a business setting, this is almost always a PowerPoint presentation (or Keynote, if you use Apple software).
#datascience #DataAnalytics #data
[35/42]
Creating and presenting presentations is a separate skill altogether, so I’ll address it later.
Creating and presenting presentations is a separate skill altogether, so I’ll address it later.
[36/42]
So, that’s it. That’s the high level data analysis process.
Let’s review …
So, that’s it. That’s the high level data analysis process.
Let’s review …
[37/42]
When you do an analysis, you:
– understand and clarify objectives
– identify data
– prepare data
– explore, plot, filter, analyze
– review results
– package results
#datascience #DataAnalytics #data
When you do an analysis, you:
– understand and clarify objectives
– identify data
– prepare data
– explore, plot, filter, analyze
– review results
– package results
#datascience #DataAnalytics #data
[38/42]
Notice that if you look at the end-to-end analysis process, only about 20 to 30% is actually creating charts and graphs ...
#datascience #DataAnalytics #data
Notice that if you look at the end-to-end analysis process, only about 20 to 30% is actually creating charts and graphs ...
#datascience #DataAnalytics #data
[39/42]
Data analyses you often require other soft skills (communicating with partners) and they also involve a lot of data preparation.
#datascience #DataAnalytics #data
Data analyses you often require other soft skills (communicating with partners) and they also involve a lot of data preparation.
#datascience #DataAnalytics #data
[40/42]
And as I mentioned previously, any of these individual steps could be an entire thread on their own.
There are many details that I’m leaving out, and for the sake of brevity, I’ll stop here.
And as I mentioned previously, any of these individual steps could be an entire thread on their own.
There are many details that I’m leaving out, and for the sake of brevity, I’ll stop here.
[41/42]
Do you have other questions about data analysis?
Leave a comment and I’ll reply.
#datascience #DataAnalytics #data
Do you have other questions about data analysis?
Leave a comment and I’ll reply.
#datascience #DataAnalytics #data
[42/42]
And if you want to learn more about data analytics and data science, then follow me here: @Josh_Ebner
Every day, I post tutorials and threads about how to do data science in Python and R.
#datascience #DataAnalytics #Python #rstats
And if you want to learn more about data analytics and data science, then follow me here: @Josh_Ebner
Every day, I post tutorials and threads about how to do data science in Python and R.
#datascience #DataAnalytics #Python #rstats
• • •
Missing some Tweet in this thread? You can try to
force a refresh