Trend System (TS) Update $BTC Midterm

Midterm: Bearish (3.5 out of 4 indicators)

- Support: 29.5k
- Bounce Resistance: 40.1K
- Trend resistance: 44.6K
- Mood: Small daily DCA and waiting for trend reversal for big investments.

Comments below
#BTC #Bitcoin Image
We had a volatile day, as expected. Hope you stayed level headed and used the ribbon to identify short term resistances.

Bullish divergence and double momentum dot still active (until a blue dot appears), so the bounce chances are still alive.

My strategy is still the same:
1) Wait for the daily trend to flip bullish using out TS.
2) DCA a little every day using our MBI to detect when to intensify the buying.
3) Buying some alts that confirmed orange dot near strong support with tight SL and aggresive profit taking.
Execute the 3 strategies require certain level of expertise, specially the third one, so don't try to do everything unless you have the experience/time.
For a broader perspective of the market please check the thread below.
Want to be consistently updated and access our custom indicators? Join our Patreon
- Newsletter
- Trend System (TS) Access and Indicators
- Max Bottom Identifier (MBI) Access
- Crypto tracker (Updated Trends of major coins)
patreon.com/Trendriders

• • •

Missing some Tweet in this thread? You can try to force a refresh
 

Keep Current with Walter - TREND RIDER

Walter - TREND RIDER Profile picture

Stay in touch and get notified when new unrolls are available from this author!

Read all threads

This Thread may be Removed Anytime!

PDF

Twitter may remove this content at anytime! Save it as PDF for later use!

Try unrolling a thread yourself!

how to unroll video
  1. Follow @ThreadReaderApp to mention us!

  2. From a Twitter thread mention us with a keyword "unroll"
@threadreaderapp unroll

Practice here first or read more on our help page!

More from @WalterCripto

Jan 29
Trend System (TS) update - $ATOM

Midterm Bullish

TR Supertrend Support: 27.20
TR Ribbon Resistance: 33.27

So far it has it has been a perfect ride using our Trend System.

What I am doing right now 🔽 Image
-I still hold a part of my initial $ATOM position (Took a lot of profits on the way following the TS process)

- I am adding a small position near TR Supertrend support with a tight Stop Loss just below it.
- As all the other 3 major trend indicators are bearish, I will close my midterm position if TR supertrend changes bearish too.

Not Financial advice.
Read 4 tweets
Jan 28
Started to DCA into $NASDAQ

Why Now?

-Since August'08 we have only went from the ranging zone (yellow) to the downtred zone (blue) 4 times.

- Also, we had bounced 2 times from similar current levels in the past d without touching the blue zone.

More 🔽 Image
The four times we went below:

- 2008-2010: -44% from current level, 722 days to recover.
- 2016:- 8.5% from curent level, 46 days to recover.
-2018-2019: 13% from current levels, 62 days to recover.
- 2020: 13% from current level, 33 days to recover.
The two times we bounce:

- 2011: TR sentiment was from yellow to pink (neutral to medium fear)
-2015: TR sentimen was from yellow to red (neutral to low fear)

Right now we are at a yellow TR sent. (neutral)

(more about our MBI model in this thread)
Read 9 tweets
Jan 28
Crypto Tracker Update - Larger list availate to Patrons.

Please have in mind that the "Possible actions" are just a guide on how to interprete all the signals. Use them to complement your own analysis, and decide accordingly❗

Timeframe: Midterm (days)

Poll below ⬇ Image
Do you find the Crypto Tracker useful?
Read 6 tweets
Jan 28
$LUNA Trend System (TS) Midterm update.

Currently Bearish

You know this one is one of my favorites, but closed what was left of my position completely , have to follow the process always.

What a ride it was! Looking forward... Image
The 41-45USD seems like a very possible resistance zone.

Our MBI indicates that $LUNA is on the raging zone (yellow zone), so volatility is expected.

Trend Sentiment is neutral, no fear yet. Image
Could we bounce tomorrow, of course! everything is possible, but I gotta follow the process consistently, no matter how I feel.

Not financial advice.
Read 4 tweets
Jan 28
$ADA Max Bottom Identifier (MBI) update

This one looks interesting, current TR Sentiment levels are getting closer to the past March'20 crash.

We are already at medium fear (different calculation than "Fear and Greed Index") and deep into the blue zone.

So... Image
As $BTC still on a midterm downtrend and Alts are more risky during time, is all up to how much you believe in $ADA for the long run and its ability to recover.

If that is the case, then Medium Fear are very good levels to start DCA.
Prices can go lower of course, in that case we probably will go into extreme fear (purple sentiment), but the price does not last long on extreme levels.
Read 5 tweets
Jan 27
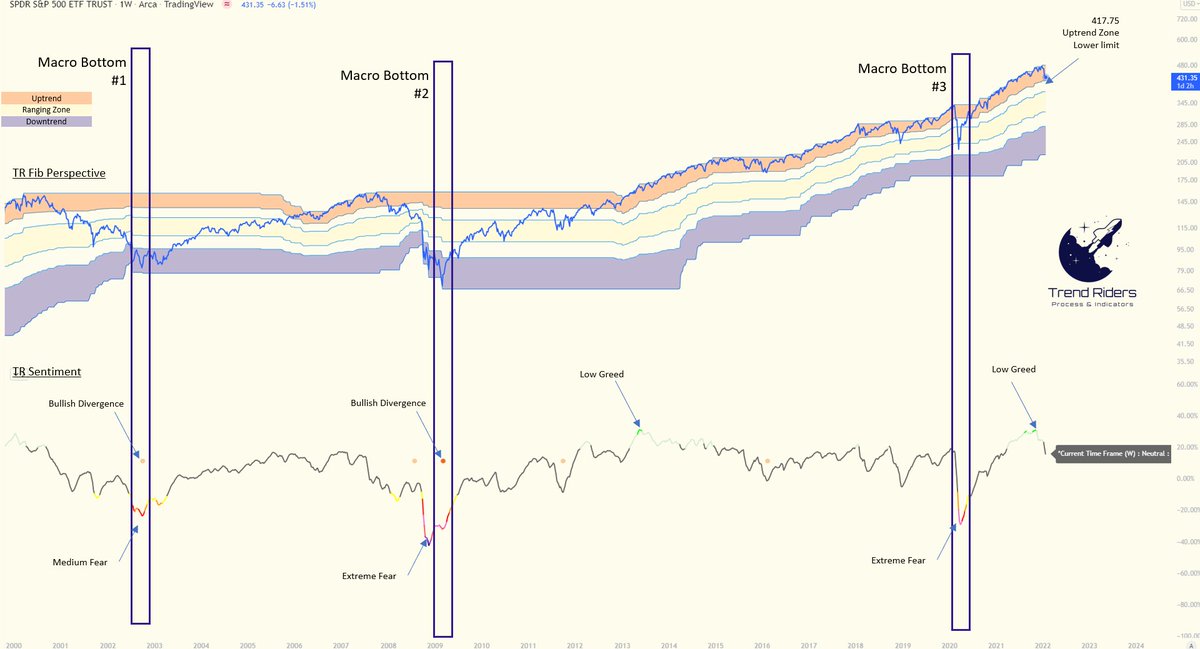
A VERY zoomed out look to the SPY (S&P500) trend. Using the Weekly timeframe.

Hope this helps to provide some perspective of where the market is right now.

Conclusions at the end.🔽🔽 Image
Facts:
- We continue on the uptrend channel.
- Uptrend Channel support at 417 USD
- Weekly sentiment is current neutral.
- Macro bottoms (best opportunities ever to buy) occur on the ranging or downtrend zone and when TR Sentiment is at medium-extreme fear.
Conclusion:

- Nothing to worry in the long term.
- DCA (buying a little every day) works great for the SPY index.
- If Macro bottom signals appear I would go all in.
Read 8 tweets

Did Thread Reader help you today?

Support us! We are indie developers!


This site is made by just two indie developers on a laptop doing marketing, support and development! Read more about the story.

Become a Premium Member ($3/month or $30/year) and get exclusive features!

Become Premium

Too expensive? Make a small donation by buying us coffee ($5) or help with server cost ($10)

Donate via Paypal

Or Donate anonymously using crypto!

Ethereum

0xfe58350B80634f60Fa6Dc149a72b4DFbc17D341E copy

Bitcoin

3ATGMxNzCUFzxpMCHL5sWSt4DVtS8UqXpi copy

Thank you for your support!

Follow Us on Twitter!

:(