Trevor Tombe Profile picture
Feb 12 12 tweets 4 min read
It's tough to know for sure what the largest tax increase in Alberta history was, but it was not the carbon tax. 🧵🤓 #ableg
First, some context. In Budget 2018 the carbon tax (just the retail levy, since I presume the UCP was not referring to the large-emitter carbon tax, which they support) was projected to be $1.5 billion by 2020/21.

That's approximately 0.4 percent of GDP. In 2017/18, it was 0.3.
I initially thought the largest tax increase would have been found back in Budget 1936 when we brought in a sales tax! That was two percent. Today that would be about 0.6 percent of GDP, so ... larger than than the CTax.
But then I remembered Budget 1987!!!
This budget contained *a lot* of tax increases (and new taxes!). The largest was personal income tax increases. (They did income taxes differently at the time, so don't worry about what those rates mean.)

This was 0.6 percent of GDP! Today equivalent to ~$2 billion.
Not only is that larger than the CTax, it was implemented right away! The CTax was phased in gradually over time. That's important, since it was really just a sequence of multiple tax increases.
Speaking of multiple tax increases, Budget 1987 kept going! Liquor and tobacco taxes went up. That was 0.3 percent of GDP. Nearly $1b equivalent today.
And what's this... a new tax: a gas tax! Five cents! 🚗That was 0.4 percent of GDP -- today equivalent to ~$1.3 billion.

Also, 5c/L is roughly the same as $23/tonne carbon tax :)
What about corporate taxes? Those went up from 10 to 15 percent ... immediately.
There were more changes to fees, fines, higher taxes on insurance companies, a new tax on hotels, and more! All together, it was nearly 2 percent of GDP (ish). Today that would be something like a $7 billion increase! In a single budget.
So, yeah, the CTax was not the largest tax increase.

Also, we can't forget the rebates!! The carbon tax setup was an increase in costs for some and a decrease for others! Roughly 40 percent of families had rebates > CTax costs. policyschool.ca/wp-content/upl…
So what really was the largest tax increase in Alberta history? I don't know. But I know what it wasn't, and now you do too! 🤓🥳

• • •

Missing some Tweet in this thread? You can try to force a refresh
 

Keep Current with Trevor Tombe

Trevor Tombe Profile picture

Stay in touch and get notified when new unrolls are available from this author!

Read all threads

This Thread may be Removed Anytime!

PDF

Twitter may remove this content at anytime! Save it as PDF for later use!

Try unrolling a thread yourself!

how to unroll video
  1. Follow @ThreadReaderApp to mention us!

  2. From a Twitter thread mention us with a keyword "unroll"
@threadreaderapp unroll

Practice here first or read more on our help page!

More from @trevortombe

Dec 14, 2021
Remarkable that following such a massive shock, federal debt services costs will average ~1.2 percent of GDP for 2021-2026. Budget 2019, prior to COVID, was projecting debt services costs of 1.2 percent from 2021 onwards.
Those claiming the fiscal sky will soon fall due to this federal borrowing are ... mistaken
Simple illustration: If beyond 2026 we have interest rates ~3 percent & NGDP growth ~4 & revenue/GDP is stable & real per capita spending is stable --> debt/GDP gets to pre-COVID levels by 2034. Far sooner than previous projections.

If spending/GDP is stable, then it's 2038.
Read 4 tweets
Sep 21, 2021
Interesting pattern in #elxn44vote: 21 ridings have CPC+PPC vote shares above the LPC or NDP winning share.

This doesn't imply CPC would have won if PPC didn't exist, of course. But it's interesting.
A non-trivial number of seats were at stake. Even if just a relatively small share of the PPC vote went to CPC. #elxn44vote
Of course, "vote splitting" is a much larger issue between LPC and NDP than between CPC and now PPC.
Read 4 tweets
Sep 15, 2021
Today's data: inflation! 📈 www150.statcan.gc.ca/n1/daily-quoti…

CPI up 4.1% in August compared to last year. Highest since 2003. Excluding food/energy (which are highly volatile), prices up 3%. #cdnecon
Important to remember, though, that much of the higher inflation we've seen in recent months is in part due to drops during COVID and prices returning to trend today means above-average inflation since last year's levels are lower.

Here's an illustration of that.
Also important to remember that the central bank looks to several measures to understand inflation pressures. Here are three of their main metrics. One exceeds the target range, the two others still don't.
Read 7 tweets
Sep 2, 2021
Seeing some claim that Canada would need 3% real GDP growth for the CPC plan to balance in ten years to work out.

I strongly disagree. Agree or disagree with the goal, it's entirely credible. I'll explain. #Elxn44 #cdnpoli
First, obviously some negative event (recession/etc) might arrive before 2031 and throw things off. But with that caveat in mind:

If federal revenues grow with the economy, then *nominal* growth of 3.8% (real of 1.8%) would result in ~565b in revenue by 2031.
How'd I get that? Well the PBO baseline projection for 2025 is 452.1 billion. And 452.1*1.038^6 = 565 billion.
Read 9 tweets
Jun 12, 2021
Today's vaccine update 💉

- Shots reported today*: 510,910 (new record!)
- Share 2nd shots: 64%- Age 12+ w/ a Shot: 72.9%
- Age 18+ w/ a Shot: 75.1% (est)
- Shots per 100 people: 74.3
- Inventory: 7.8 days

More: trevortombe.github.io/covidgraphs/
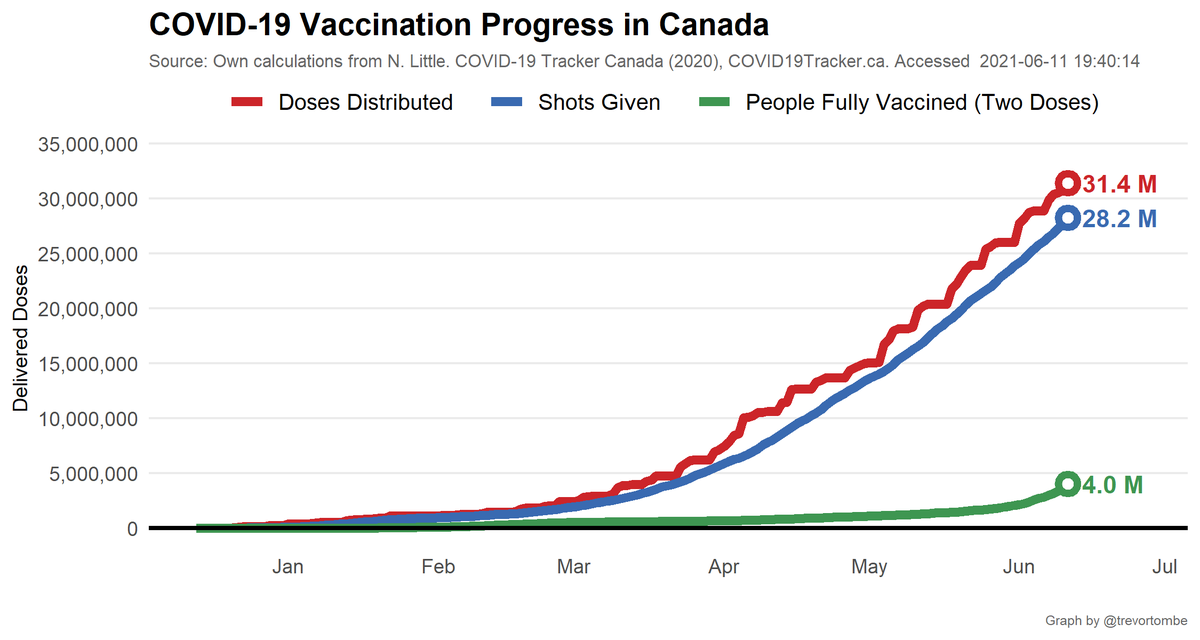
In total, Canada is now up to 28.2 million shots given -- which is 89.9% of the total 31.4 million doses available. Over the past 7 days, 2,546,940 doses have been delivered to provinces.

And so far 4.0 million are fully vaccinated with two shots.
The latest estimates of vaccinations by age:

- Those 60+: 89.8% have at least one dose and 26.5% have two
- 18-59: it's 68.7% and 8.7%
- Adults: 75.1% and 14.1%

Note: data comes with a 6-13 day lag; these are my own estimates
Read 15 tweets
Jun 11, 2021
Today's vaccine update 💉

- Shots reported today*: 471,409 (63% 2nd doses)
- Total shots: 27,729,183
- Age 12+ w/ a Shot: 72.3%
- Age 18+ w/ a Shot: 73.8% (est)
- Shots per 100 people: 73.0
- Inventory: 7.3 days

More: trevortombe.github.io/covidgraphs/

* Missing YT (not reported yet)
The latest estimates of vaccinations by age:

- Those 60+: 89.4% have at least one dose and 21.0% have two
- 18-59: it's 67.0% and 9.0%
- Adults: 73.8% and 12.7%

Note: data comes with a 6-13 day lag; these are my own estimates
In total, Canada is now up to 27.7 million shots given -- which is 90.4% of the total 30.7 million doses available. Over the past 7 days, 1,925,050 doses have been delivered to provinces.

And so far 3.7 million are fully vaccinated with two shots.
Read 13 tweets

Did Thread Reader help you today?

Support us! We are indie developers!


This site is made by just two indie developers on a laptop doing marketing, support and development! Read more about the story.

Become a Premium Member ($3/month or $30/year) and get exclusive features!

Become Premium

Don't want to be a Premium member but still want to support us?

Make a small donation by buying us coffee ($5) or help with server cost ($10)

Donate via Paypal

Or Donate anonymously using crypto!

Ethereum

0xfe58350B80634f60Fa6Dc149a72b4DFbc17D341E copy

Bitcoin

3ATGMxNzCUFzxpMCHL5sWSt4DVtS8UqXpi copy

Thank you for your support!

:(