Average consumer prices in January 2022 were 5.1% higher than a year earlier. Highest since 1991. Excluding energy, prices were 4% higher. www150.statcan.gc.ca/n1/daily-quoti…#cdnecon
What's behind the accelerating inflation rate? This visual might help. It decomposes the change in inflation due to several important components. Energy prices and household depreciation account for most of the change.
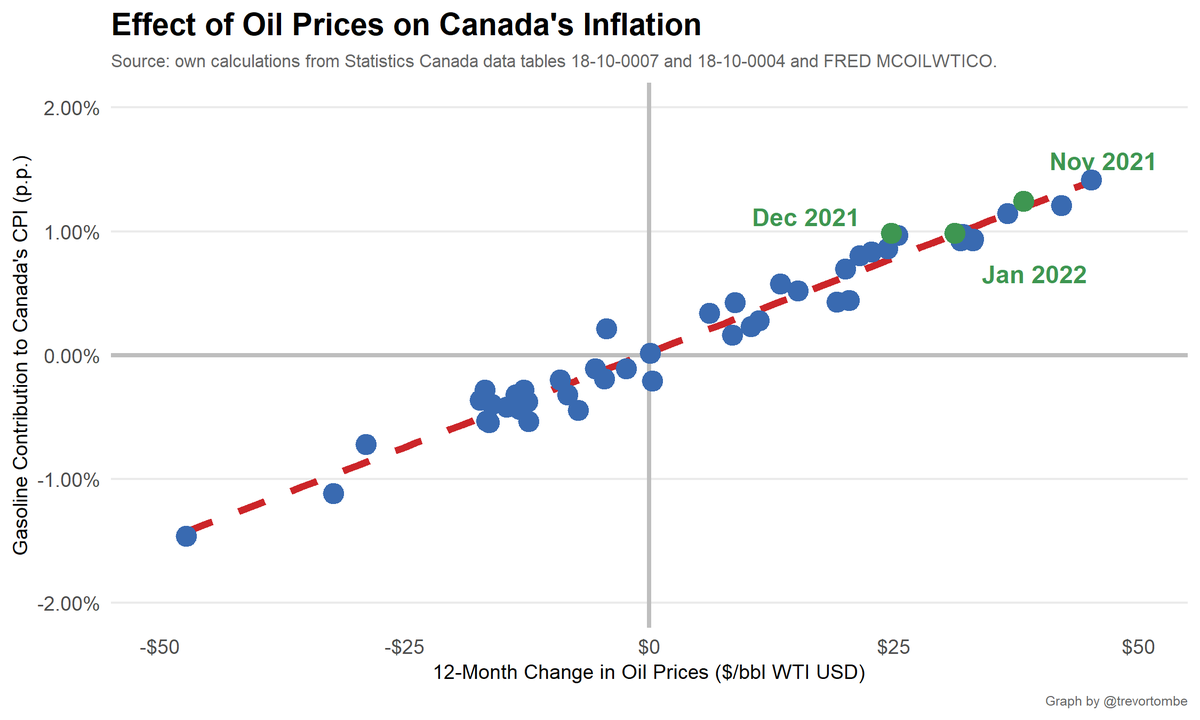
That piece also explains why energy is a large contributor to inflation. The strong link between global oil prices and the gasoline contribution to CPI remains the case in January. This is important context some politicos neglect.
• • •
Missing some Tweet in this thread? You can try to
force a refresh
First, some context. In Budget 2018 the carbon tax (just the retail levy, since I presume the UCP was not referring to the large-emitter carbon tax, which they support) was projected to be $1.5 billion by 2020/21.
That's approximately 0.4 percent of GDP. In 2017/18, it was 0.3.
I initially thought the largest tax increase would have been found back in Budget 1936 when we brought in a sales tax! That was two percent. Today that would be about 0.6 percent of GDP, so ... larger than than the CTax.
Remarkable that following such a massive shock, federal debt services costs will average ~1.2 percent of GDP for 2021-2026. Budget 2019, prior to COVID, was projecting debt services costs of 1.2 percent from 2021 onwards.
Those claiming the fiscal sky will soon fall due to this federal borrowing are ... mistaken
Simple illustration: If beyond 2026 we have interest rates ~3 percent & NGDP growth ~4 & revenue/GDP is stable & real per capita spending is stable --> debt/GDP gets to pre-COVID levels by 2034. Far sooner than previous projections.
CPI up 4.1% in August compared to last year. Highest since 2003. Excluding food/energy (which are highly volatile), prices up 3%. #cdnecon
Important to remember, though, that much of the higher inflation we've seen in recent months is in part due to drops during COVID and prices returning to trend today means above-average inflation since last year's levels are lower.
Here's an illustration of that.
Also important to remember that the central bank looks to several measures to understand inflation pressures. Here are three of their main metrics. One exceeds the target range, the two others still don't.
In total, Canada is now up to 28.2 million shots given -- which is 89.9% of the total 31.4 million doses available. Over the past 7 days, 2,546,940 doses have been delivered to provinces.
And so far 4.0 million are fully vaccinated with two shots.
The latest estimates of vaccinations by age:
- Those 60+: 89.8% have at least one dose and 26.5% have two
- 18-59: it's 68.7% and 8.7%
- Adults: 75.1% and 14.1%
Note: data comes with a 6-13 day lag; these are my own estimates