2/28 Texas C19 Weekly Update
THREAD
* Weekly check-in to make sure Covid is trending in the right direction & to raise the flag if its not
* Let's take a look!
1/n
.
THREAD
* Weekly check-in to make sure Covid is trending in the right direction & to raise the flag if its not
* Let's take a look!
1/n
.
https://twitter.com/therealarod1984/status/1496112850242359297
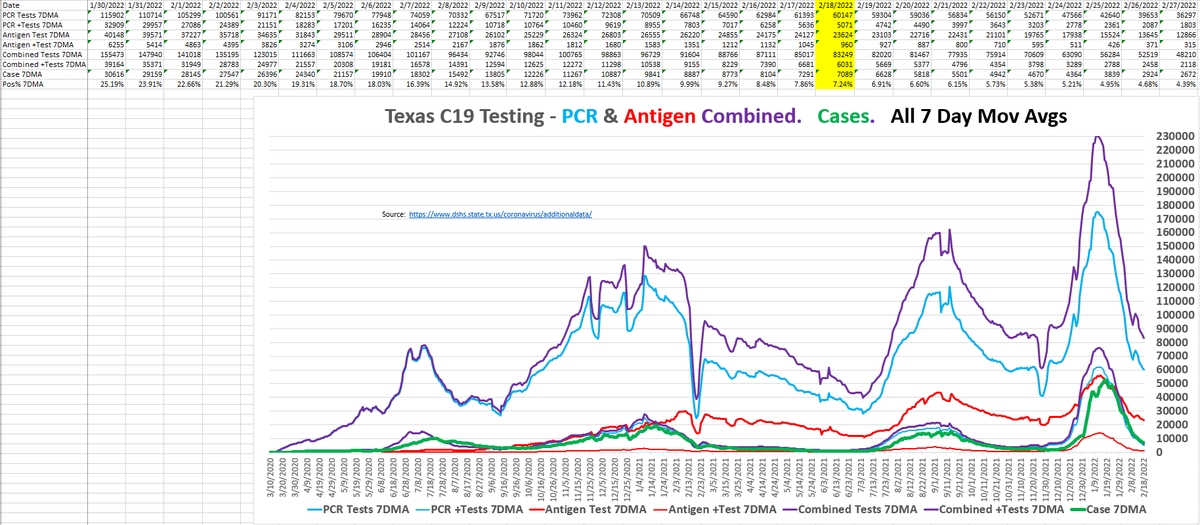
2/28 -Test reporting is by date of specimen collection, you have to wait ~10 days for a date to be ~90-95% in.
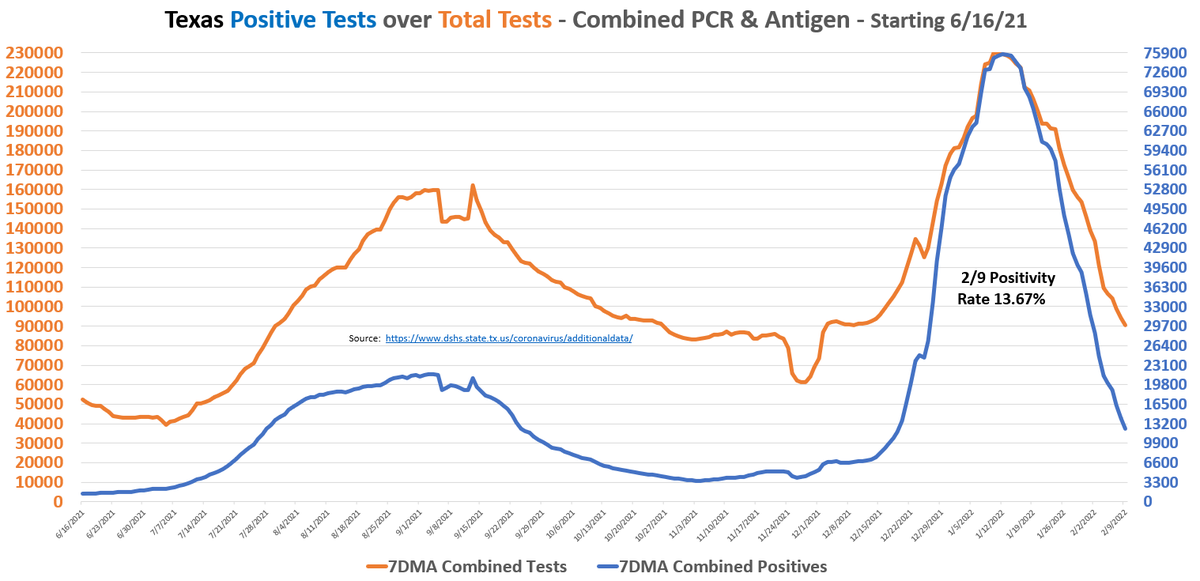
As of 2/18:
* Positivity rate @ 7.24% down 5 points from LW
* Testing now at pre-Omicron levels ~80K/day
* More cases than positive tests for a while now
#backlog
2/n


As of 2/18:
* Positivity rate @ 7.24% down 5 points from LW
* Testing now at pre-Omicron levels ~80K/day
* More cases than positive tests for a while now
#backlog
2/n


2/28 - Cases are simply reported as they are received by the counties.
Case 7DMA
* 3K per day, down from 5.5K LW
* has been down 1/3rd to 1/2 from the previous week for 30 straight days
* Down 94.2% from peak 6 weeks ago
* How long will it go? Likely a ways
3/n
.


Case 7DMA
* 3K per day, down from 5.5K LW
* has been down 1/3rd to 1/2 from the previous week for 30 straight days
* Down 94.2% from peak 6 weeks ago
* How long will it go? Likely a ways
3/n
.


2/28 - Hospitalizations
* Covid Admissions and Hospital Census declines just now starting to slow, but still -30%
* Admits basically down to pre-Omicron wave levels
* Covid % of total beds down to 6%
* General Census likely continues to fall over the next week
4/n
.


* Covid Admissions and Hospital Census declines just now starting to slow, but still -30%
* Admits basically down to pre-Omicron wave levels
* Covid % of total beds down to 6%
* General Census likely continues to fall over the next week
4/n
.


2/28 Severe Hospitalizations
* Both the ICU and Vent waves are totally over. They are both back down to pre-Omicron levels
* The only question now is will they continue to fall & approach historic lows we saw in May and June 2021
* Nothing compared to 2020 Winter waves
5/n
.


* Both the ICU and Vent waves are totally over. They are both back down to pre-Omicron levels
* The only question now is will they continue to fall & approach historic lows we saw in May and June 2021
* Nothing compared to 2020 Winter waves
5/n
.


2/28 - Conclusion
The only interesting thing to watch in the next couple of weeks will be to see if the numbers continue to crash or if they flatten out.
Short term looks like there is plenty of decline left. We shall see.
The only interesting thing to watch in the next couple of weeks will be to see if the numbers continue to crash or if they flatten out.
Short term looks like there is plenty of decline left. We shall see.
• • •
Missing some Tweet in this thread? You can try to
force a refresh


