2/28 Domestic Airline Travel Update:

THREAD

* A short Omicron induced lull in January & early February is over
* President's Day brought travel back to Holiday season levels
* @Hold2LLC @pilotshive, others telling me they think the airline Mask Mandate goes away soon???

1/n
@Hold2LLC @pilotshive Airline numbers Page 2

Back to near 2 million passengers in the 7 Day moving average (7DMA), which we've only seen at 3 other times during C19: Summer 2021, Thanksgiving 2021, and Christmas 2021.

2 years ago, 7DMA was running a little north of 2.2 Million

2/n Image
@Hold2LLC @pilotshive Airline numbers Page 3

Traffic rapidly back up to near 90% of 2020 which has only been seen during Thanksgiving 2021. Omicron dropped the YoY to between 70-75%, but airline travel has become more and more resilient to Covid variants over the past 12 months.

3/n Image
@Hold2LLC @pilotshive Airline numbers Page 4

Will the end of the mask mandate be announced tomorrow? I'm not as confident as some others, I'd says its 50/50 at best. I hope I'm wrong.

But even if dropped, it will be a challenge for the airlines to restore traffic to 100% and beyond. Why?

4/n Image
@Hold2LLC @pilotshive Airline numbers Page 5

* Pilot shortage - a long term problem looms with FAA requirements, pilot retirement age, & costs to become a pilot
* Staff shortage - The 2020-2021 mass layoff/furlough problem + general labor market challenges makes ramping up staff very difficult Image
@Hold2LLC @pilotshive Airline numbers - Conclusion

Other problems include the ability of both Boeing and Airbus to deliver new aircraft, and a general ceiling on the number of jets that can be un-parked & staffed.

I hope we hear the Mask Mandate is ending. We'll track the numbers here!

6/end Image

• • •

Missing some Tweet in this thread? You can try to force a refresh
 

Keep Current with therealarod1984

therealarod1984 Profile picture

Stay in touch and get notified when new unrolls are available from this author!

Read all threads

This Thread may be Removed Anytime!

PDF

Twitter may remove this content at anytime! Save it as PDF for later use!

Try unrolling a thread yourself!

how to unroll video
  1. Follow @ThreadReaderApp to mention us!

  2. From a Twitter thread mention us with a keyword "unroll"
@threadreaderapp unroll

Practice here first or read more on our help page!

More from @therealarod1984

Feb 28
2/28 Texas C19 Weekly Update

THREAD

* Weekly check-in to make sure Covid is trending in the right direction & to raise the flag if its not
* Let's take a look!

1/n
.
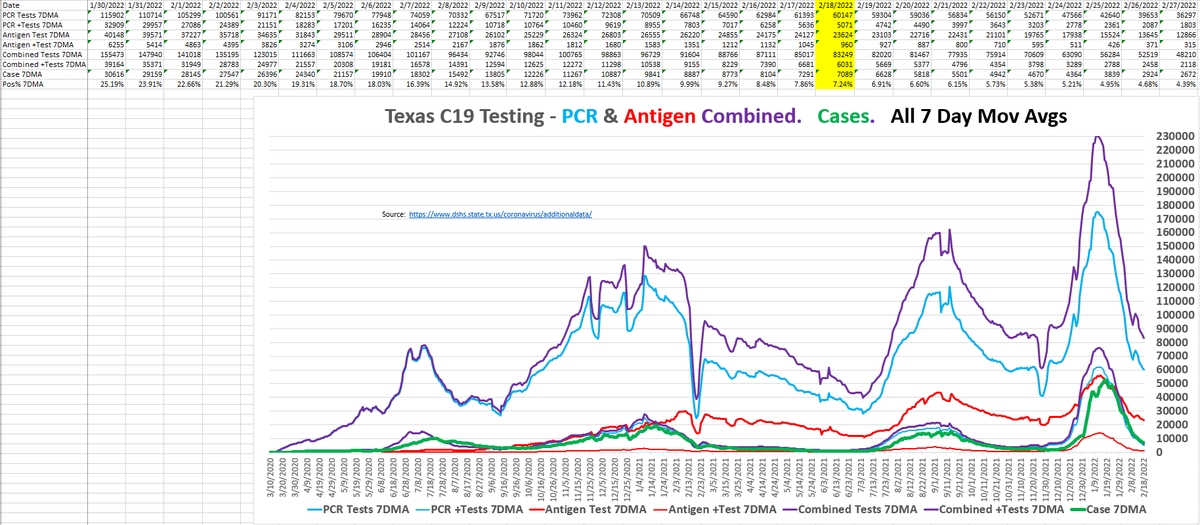
2/28 -Test reporting is by date of specimen collection, you have to wait ~10 days for a date to be ~90-95% in.

As of 2/18:

* Positivity rate @ 7.24% down 5 points from LW
* Testing now at pre-Omicron levels ~80K/day
* More cases than positive tests for a while now
#backlog

2/n ImageImageImageImage
2/28 - Cases are simply reported as they are received by the counties.

Case 7DMA
* 3K per day, down from 5.5K LW
* has been down 1/3rd to 1/2 from the previous week for 30 straight days
* Down 94.2% from peak 6 weeks ago
* How long will it go? Likely a ways

3/n
. ImageImageImageImage
Read 6 tweets
Feb 26
2/25 - Texas C19 Wave Severity Analysis

THREAD:

Analysis of severe outcomes for the Winter 2021 Omicron wave

* Hospitalizations approaching traditional C19 floors, interesting to see if they crash below that
* Jan 28 was fatality peak, CFR still below flu

1/n
2/25 TX Severe outcomes - Page 2

* Numbers through 2/24, Cases 7DMA falling through 4K per day
* Hospitalization Census 7DMA below 5K and still collapsing
* Rapidly approaching traditional Covid floor of 2K cases and 3K hospitalization census

2/n Image
2/25 TX Severe outcomes - Page 3

Now just the hospitalization metrics on a two axis chart:

* ICU & Vent peaks are basically over
* Both nearing traditional floors of 1K & 550
* Will see if they continue to fall through those and approach new lows seen briefly last spring

3/n Image
Read 8 tweets
Feb 21
2/20 - Texas C19 Wave Severity Analysis

THREAD:

Analysis of severe hospitalizations and outcomes for the Winter 2021 Omicron wave. Updates for:

* Hospital Census
* ICU
* Vents
* Fatalities & CFR - can confidently project Jan 28 as the fatality peak for this wave

1/n
2/20 TX Severe outcomes - Page 2

* Numbers through 2/19, Cases 7DMA falling through 6K per day
* Hospitalization Census 7DMA also into the 6K range and still falling fast
* While 2020 Winter wave was 5 months long from end to end, 2021 Winter will be less than 3

2/n
2/20 TX Severe outcomes - Page 3

Now just the hospitalization metrics on a two axis chart:

* Peaks for this wave were 95% of previous Census record, 73% of ICU, and 52% of Vents
* Not only that, but the waves were shorter in length. Aggregates should be even less

3/n
Read 8 tweets
Feb 19
2/19 Texas C19 Update - Exit Stage Left

THREAD

* Probably one mid week report left, and then I'll go to once a week to keep my eyes on things
* Everything still collapsing
* Let's take a look!

1/n
.
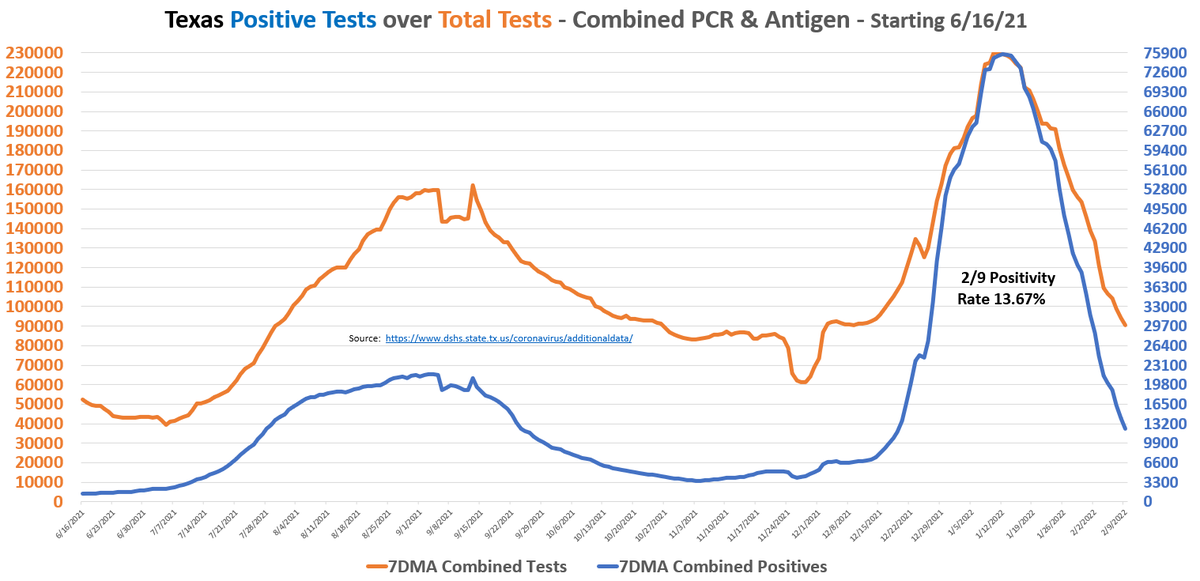
2/19 -Test reporting is by date of specimen collection, you have to wait ~10 days for a date to be ~90-95% in.

As of 2/9:

* Positivity rate down to 13.67%, and from here the decline starts to slow
* An interesting bump in testing occurred 2/10-2/14, but its falling again

2/n
2/19 - Cases are simply reported as they are received by the counties.

Case 7DMA
* now down to 6.6K
* has been down 1/3rd to 1/2 from the previous week (WoW) for 21 straight days
* Cases down 87% from peak

3/n
.
Read 6 tweets
Feb 16
2/16 - Texas C19 Wave Severity Analysis

THREAD:

Analysis of severe hospitalizations and outcomes for the Winter 2021 Omicron wave. Updates for:

* Hospital Census
* ICU
* Vents
* Fatalities & CFR - projecting into hospitalization peak now

1/n
2/16 TX Severe outcomes - Page 2

* Numbers through 2/15, Cases falling through 8K per day
* Hospitalization Census into the 7K range and falling fast
* Crazy high case peak, while hospitalizations were less than previous waves...

2/n
2/16 TX Severe outcomes - Page 3

Now just the hospitalization metrics on a two axis chart:

* All the hospitalization metrics in freefall
* Notice again how much smaller this ICU/vent peak is than previous Covid waves
* Fatalities are actual thru 1/11, projected thru 1/25

3/n
Read 8 tweets
Feb 16
2/15 Texas C19 Update - Omicron go Night Night...

THREAD

* Cases running north of 100% of positive tests, meaning we are seeing a lot of catch up and backlog being reported
* Despite this, Case 7DMA now below 9K
* Hospitalizations, including ICU/Vents continue freefall

1/n
.
2/15 -Test reporting is by date of specimen collection, you have to wait ~10 days for a date to be ~90-95% in.

As of 2/5:

* Pos rate 7DMA down to 18.78% & declining a point a day
* More cases being reported than there are positive tests, starting 2/3 & next several days

2/n
2/15 - Cases are simply reported as they are received by the counties.

Case 7DMA
* now down to 8.7K
* has been down 1/3rd to 1/2 from the previous week (WoW) for 17 straight days
* The decline is slowing because reporting per 2/n and there is little room to fall now.

3/n
.
Read 6 tweets

Did Thread Reader help you today?

Support us! We are indie developers!


This site is made by just two indie developers on a laptop doing marketing, support and development! Read more about the story.

Become a Premium Member ($3/month or $30/year) and get exclusive features!

Become Premium

Don't want to be a Premium member but still want to support us?

Make a small donation by buying us coffee ($5) or help with server cost ($10)

Donate via Paypal

Or Donate anonymously using crypto!

Ethereum

0xfe58350B80634f60Fa6Dc149a72b4DFbc17D341E copy

Bitcoin

3ATGMxNzCUFzxpMCHL5sWSt4DVtS8UqXpi copy

Thank you for your support!

Follow Us on Twitter!

:(