
🎯Daily True Range🎯
Daily True Range is different from a known indicator ATR or Average True Range
.
A quick read to understand the difference and relevance of DTR.
.
Do share & like to maximize the reach.
#Stockmarket #trading
Daily True Range is different from a known indicator ATR or Average True Range
.
A quick read to understand the difference and relevance of DTR.
.
Do share & like to maximize the reach.
#Stockmarket #trading
Most of us have to make trading decisions on how much price rise or fall to expect on Intra Day Trading.
For that one needs to know the average volatility on a day and the scope of further range at the time of entering an intraday trade.
For that one needs to know the average volatility on a day and the scope of further range at the time of entering an intraday trade.
We use ATR as an indicator for true range on a day.
But ATR includes the range of Gaps too.
Ironically, post Open, the Gap rise or fall is worth holding overnight positions.
Post Open, assessing what balance price range is achievable on a day is not easy to guess.
But ATR includes the range of Gaps too.
Ironically, post Open, the Gap rise or fall is worth holding overnight positions.
Post Open, assessing what balance price range is achievable on a day is not easy to guess.
Traders need to know this average price range or volatility on a day after the Gaps to execute their Exits.
Such volatility measure of an asset, that is restricted to a day’s movement, irrespective of Gap range, is referred to as Daily True Range 'DTR'.
Such volatility measure of an asset, that is restricted to a day’s movement, irrespective of Gap range, is referred to as Daily True Range 'DTR'.
Daily True Range ("DTR")
.
DTR is the difference between High & Low to the Open of the Day.
🔹It guides on Price Flow for a Day for an asset.
🔹It is noted in Absolute Value & Percentages.
🔹Helps to gauge if it has reached the maximum
capable volatility for the day.
.
DTR is the difference between High & Low to the Open of the Day.
🔹It guides on Price Flow for a Day for an asset.
🔹It is noted in Absolute Value & Percentages.
🔹Helps to gauge if it has reached the maximum
capable volatility for the day.
Daily True Range ("DTR") does not provide Direction.
The direction of Trade can best be considered by triggers from Directional Indicators.
DTR provides the balance scope in the price range in the direction of trade.
The extent of scope varies in an asset.
The direction of Trade can best be considered by triggers from Directional Indicators.
DTR provides the balance scope in the price range in the direction of trade.
The extent of scope varies in an asset.
Every asset has a Daily Range and can be classified into two kinds in terms of the nature of the day
✅ Event Day
✅ Non-Event Day
✅ Event Day
✅ Non-Event Day
Non Event Days ("NED"):
These are days when there is no trigger event for the asset like war news, corporate results, etc...
Event Days ("ED"):
These are the days the asset is volatile beyond its average daily volatility.
Volatility on ED is on an average 2 or more times NED.
These are days when there is no trigger event for the asset like war news, corporate results, etc...
Event Days ("ED"):
These are the days the asset is volatile beyond its average daily volatility.
Volatility on ED is on an average 2 or more times NED.

One needs data of daily High Low Difference over a period of one to two years.
The Average of such is referred to as DTRA.
Apart from Event Days & Non Event Days, one can also divide Volatility session-wise.
Open Session have very high Volatile prices.
The Average of such is referred to as DTRA.
Apart from Event Days & Non Event Days, one can also divide Volatility session-wise.
Open Session have very high Volatile prices.
If it does most of the NED DTR during the Open Session, it may not move much during the day unless it has done a Breakout from the Open Session Range.
If done, it can further keep rising through the Mid-Session till the closing session, moving from NED to ED Range
If done, it can further keep rising through the Mid-Session till the closing session, moving from NED to ED Range
Another way to deal with DTR is to consider an Open Range Session of 15mins and note its absolute and percentage value.
We call it DTR(OR).
Let's see the case below.
We call it DTR(OR).
Let's see the case below.
Nifty Spot 5min Chart 11Mar22
There are two encircled values.
On the left 145.15 pts and 0.88% which is Volatility in the first 15mins.
On the right, the Value is 221.45 pts 1.34% which is Volatility by the end of the day.
There are two encircled values.
On the left 145.15 pts and 0.88% which is Volatility in the first 15mins.
On the right, the Value is 221.45 pts 1.34% which is Volatility by the end of the day.
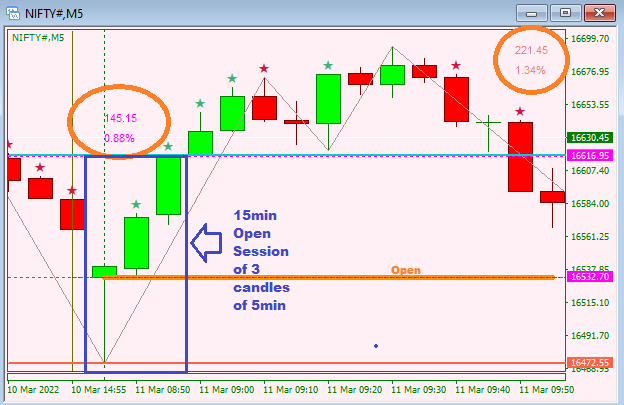
Statistically, we have fixed Nifty NED % as
<0.70 % for Open Range i.e. DTR(OR) and
1.80% as DTRA for the day.
On 11Mar22 DTR(OR) was 0.88% which was higher than DTR(OR) fixed at 0.7% for a NED.
We assess the Scope as below.
<0.70 % for Open Range i.e. DTR(OR) and
1.80% as DTRA for the day.
On 11Mar22 DTR(OR) was 0.88% which was higher than DTR(OR) fixed at 0.7% for a NED.
We assess the Scope as below.
Knowing DTRA, we arrive at scope left in percentage terms referred to as DTRL i.e. of a likely further rise or decline as the case may be.
DTRL = DTRA – DTR(OR)
If you are a Momentum Trader then Momentum Trigger could be one more event to track DTR as DTRM.
DTRL = DTRA – DTRM
DTRL = DTRA – DTR(OR)
If you are a Momentum Trader then Momentum Trigger could be one more event to track DTR as DTRM.
DTRL = DTRA – DTRM
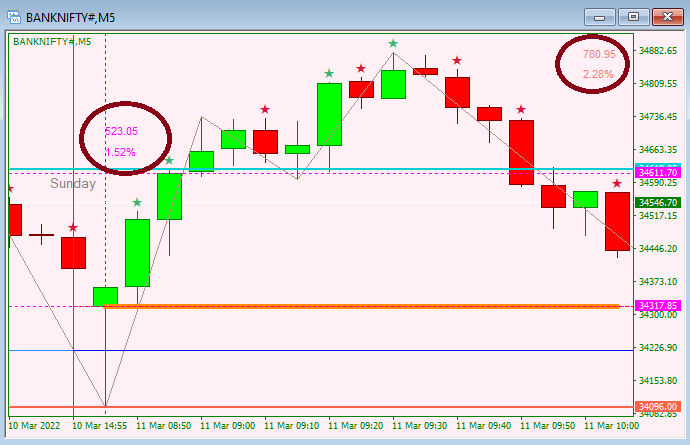
Example1: BankNifty Spot 5min
Statistically, we have fixed BankNifty NED % as
< 1.00 % for DTR(OR) and Up to 2.70% as DTR for the day.
Knowing DTR(OR) 523 1.52%,
Scope DTRL = DTR - DTR(OR) = 2.7 - 1.52 = 1.18
DTR (end of Day) was 780.95 2.28%
much lower though.
Statistically, we have fixed BankNifty NED % as
< 1.00 % for DTR(OR) and Up to 2.70% as DTR for the day.
Knowing DTR(OR) 523 1.52%,
Scope DTRL = DTR - DTR(OR) = 2.7 - 1.52 = 1.18
DTR (end of Day) was 780.95 2.28%
much lower though.
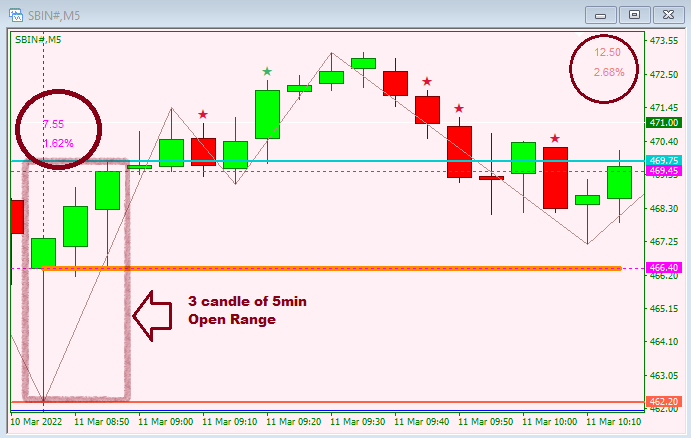
Example2: SBI Spot 5min Chart
Statistically, we have fixed SBI NED % as
< 0.60 % for DTR(OR) and Up to 2.70% as DTR.
Knowing DTR(OR) 7.55 1.62%
Scope DTRL = DTR - DTR(OR) = 2.7 - 1.62 = 1.18
DTR (end of Day) was 12.50pts 2.68%
DTR Achieved was as per NED.
Statistically, we have fixed SBI NED % as
< 0.60 % for DTR(OR) and Up to 2.70% as DTR.
Knowing DTR(OR) 7.55 1.62%
Scope DTRL = DTR - DTR(OR) = 2.7 - 1.62 = 1.18
DTR (end of Day) was 12.50pts 2.68%
DTR Achieved was as per NED.
Moving forward
Find statistical DTRA for Cash, Futures, Commodities and arrive at NED %
If NED is 3.23 % then ED% can be 6.85, 11.10, and so on, by skipping one slab 4.23% and starting ED % from 6.85. 11.10 and so on
The same table multiply by 10 times when applied to Options.
Find statistical DTRA for Cash, Futures, Commodities and arrive at NED %
If NED is 3.23 % then ED% can be 6.85, 11.10, and so on, by skipping one slab 4.23% and starting ED % from 6.85. 11.10 and so on
The same table multiply by 10 times when applied to Options.
You can further read more on the blog:
nimblrschool.com/blog/dailytrue…
The Content may be verified before use.
The Thread is for your observation, guidance, and for your further research and statistical journey.
Thank you for reading
nimblrschool.com/blog/dailytrue…
The Content may be verified before use.
The Thread is for your observation, guidance, and for your further research and statistical journey.
Thank you for reading
• • •
Missing some Tweet in this thread? You can try to
force a refresh


