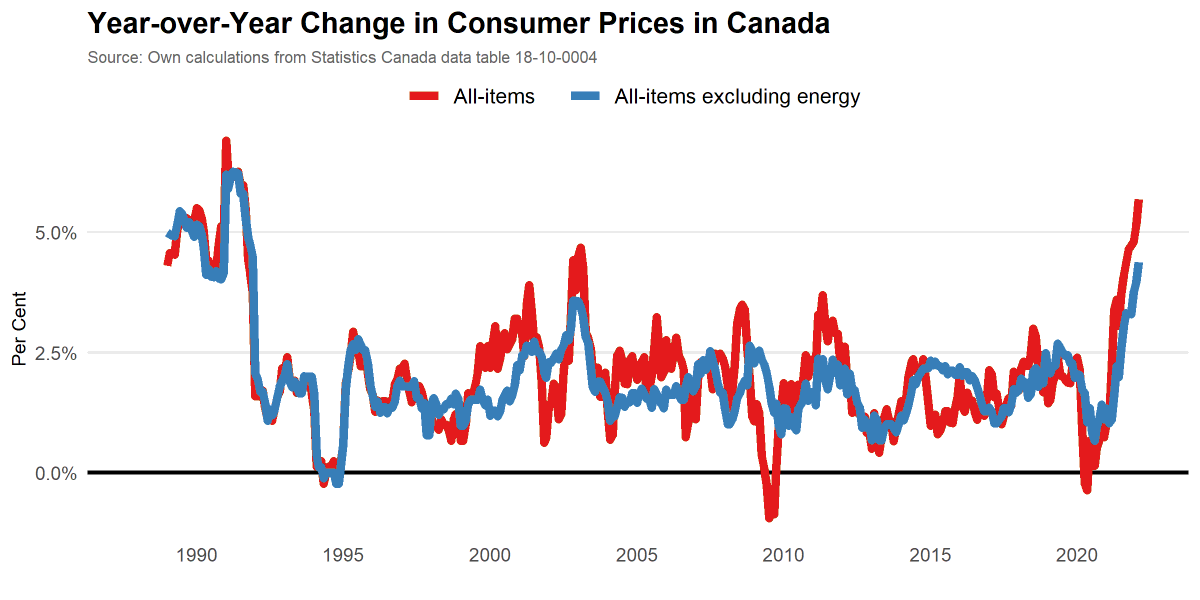
Price increases are also broad based across many product categories. Approximately two in three items within the CPI saw price increases above 3%.
What's behind the acceleration of inflation? Two years ago, the rate was close to 2% (near the target). The increase to 5% is due to just a few items: groceries, gasoline, home depreciation, fuel. Here's an illustration.
Here's another way to see the drivers behind recently high inflation in #cdnecon.
And with energy as the single largest contributor, it's worth remembering why that's the case: global oil prices. Feb 2022 gasoline contribution to inflation is precisely where you'd predict given the change in oil prices.
Some evidence of supply chain related pressure on CPI easing? New car prices are gradually declining in its contribution to CPI changes. Groceries, however, are increasing.
Last plot from today's inflation data: services price increases remain at the 2 percent target once one excludes shelter. This is relevant to watch to see extent to which wage pressures may contribute to inflation.
• • •
Missing some Tweet in this thread? You can try to
force a refresh
This time last year, Alberta was anticipating an $11b deficit for 2022/23. Now, the government expects a surplus of $511 million ($2.3b excluding contingency).
Massive turnaround. Here's a decomposition of the relevant changes. #ableg
There will be two competing stories out there. Both have elements of truth.
1) The government had little to do with the improvement. It's all oil prices.
2) The government's fiscal/economic policies made today's surplus possible.
High oil prices increase both resource revenues and increase corporate income taxes. That's basically the whole ballgame relative to where Budget 2021 was projecting for 2022/23.
Average consumer prices in January 2022 were 5.1% higher than a year earlier. Highest since 1991. Excluding energy, prices were 4% higher. www150.statcan.gc.ca/n1/daily-quoti…#cdnecon
What's behind the accelerating inflation rate? This visual might help. It decomposes the change in inflation due to several important components. Energy prices and household depreciation account for most of the change.
First, some context. In Budget 2018 the carbon tax (just the retail levy, since I presume the UCP was not referring to the large-emitter carbon tax, which they support) was projected to be $1.5 billion by 2020/21.
That's approximately 0.4 percent of GDP. In 2017/18, it was 0.3.
I initially thought the largest tax increase would have been found back in Budget 1936 when we brought in a sales tax! That was two percent. Today that would be about 0.6 percent of GDP, so ... larger than than the CTax.
Remarkable that following such a massive shock, federal debt services costs will average ~1.2 percent of GDP for 2021-2026. Budget 2019, prior to COVID, was projecting debt services costs of 1.2 percent from 2021 onwards.
Those claiming the fiscal sky will soon fall due to this federal borrowing are ... mistaken
Simple illustration: If beyond 2026 we have interest rates ~3 percent & NGDP growth ~4 & revenue/GDP is stable & real per capita spending is stable --> debt/GDP gets to pre-COVID levels by 2034. Far sooner than previous projections.
CPI up 4.1% in August compared to last year. Highest since 2003. Excluding food/energy (which are highly volatile), prices up 3%. #cdnecon
Important to remember, though, that much of the higher inflation we've seen in recent months is in part due to drops during COVID and prices returning to trend today means above-average inflation since last year's levels are lower.
Here's an illustration of that.
Also important to remember that the central bank looks to several measures to understand inflation pressures. Here are three of their main metrics. One exceeds the target range, the two others still don't.