
This time last year, Alberta was anticipating an $11b deficit for 2022/23. Now, the government expects a surplus of $511 million ($2.3b excluding contingency).
Massive turnaround. Here's a decomposition of the relevant changes. #ableg
Massive turnaround. Here's a decomposition of the relevant changes. #ableg

There will be two competing stories out there. Both have elements of truth.
1) The government had little to do with the improvement. It's all oil prices.
2) The government's fiscal/economic policies made today's surplus possible.
1) The government had little to do with the improvement. It's all oil prices.
2) The government's fiscal/economic policies made today's surplus possible.
High oil prices increase both resource revenues and increase corporate income taxes. That's basically the whole ballgame relative to where Budget 2021 was projecting for 2022/23.
Not due to government.
Not due to government.
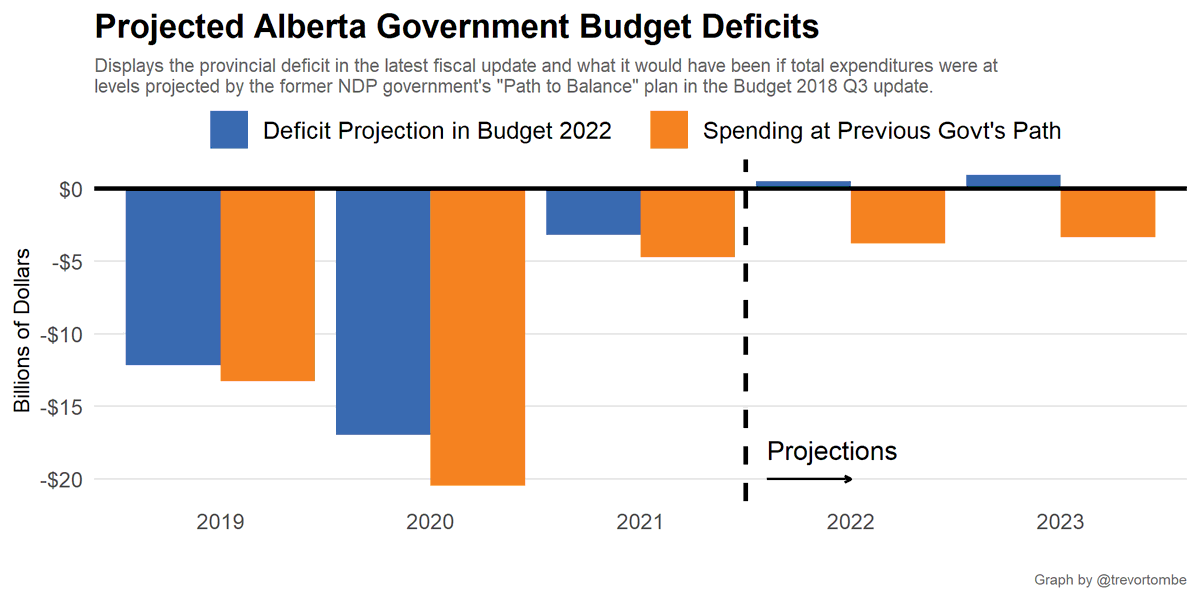
BUT the government did lower the spending trajectory in Alberta relative to the previous government. Aligning per capita spending to other provinces.
This helped a lot.
This helped a lot.
https://twitter.com/trevortombe/status/1496974628878577686?s=20&t=nhNddwNMV_TNdLxIHNXfHQ
For perspective, had spending continued with 2018 Q3 plan (prev govt), then there'd be a deficit of nearly $4b in 2022/23 despite the higher prices.
But (and this is an important but), the budget energy price assumptions are *very* conservative. Very.
I mean, who knows where oil prices will be in the future, but the market expects much much higher than budgeted for.
I mean, who knows where oil prices will be in the future, but the market expects much much higher than budgeted for.

At these higher prices, even the previous government expenditure plan would have been in surplus in 2022/23. At WTI comes in at 85 in 2022/23 and 86 in 2023/24 then here's the picture.

It's also worth noting that previous government would have had higher revenues because of modestly higher tax rates (CIT in particular, which would have earned a higher share of rising profits from high oil prices).
In any case, definitely an interesting debate.
A better discussion would be about how Alberta gets off the royalty rollercoaster. We remain exposed to significant fiscal risk.
We haven't entertained saving resource revenues since 2015. Perhaps it's time again?
A better discussion would be about how Alberta gets off the royalty rollercoaster. We remain exposed to significant fiscal risk.
We haven't entertained saving resource revenues since 2015. Perhaps it's time again?

• • •
Missing some Tweet in this thread? You can try to
force a refresh


