Ember Profile picture
Mar 30, 2022 10 tweets 12 min read Read on X
BREAKING | #Wind & #Solar hit a record TENTH of global electricity in 2021.

But the global electricity transition needs to sustain high growth rates to replace coal & reduce emissions.

⚡️10 Tweet Thread of the Global Power Sector in 2021

[1/10] #GER22
ember-climate.org/insights/resea…
We analysed annual power generation data for 209 countries from 2000 to 2020, with 2021 data included for 75 countries representing 93% of global power demand.

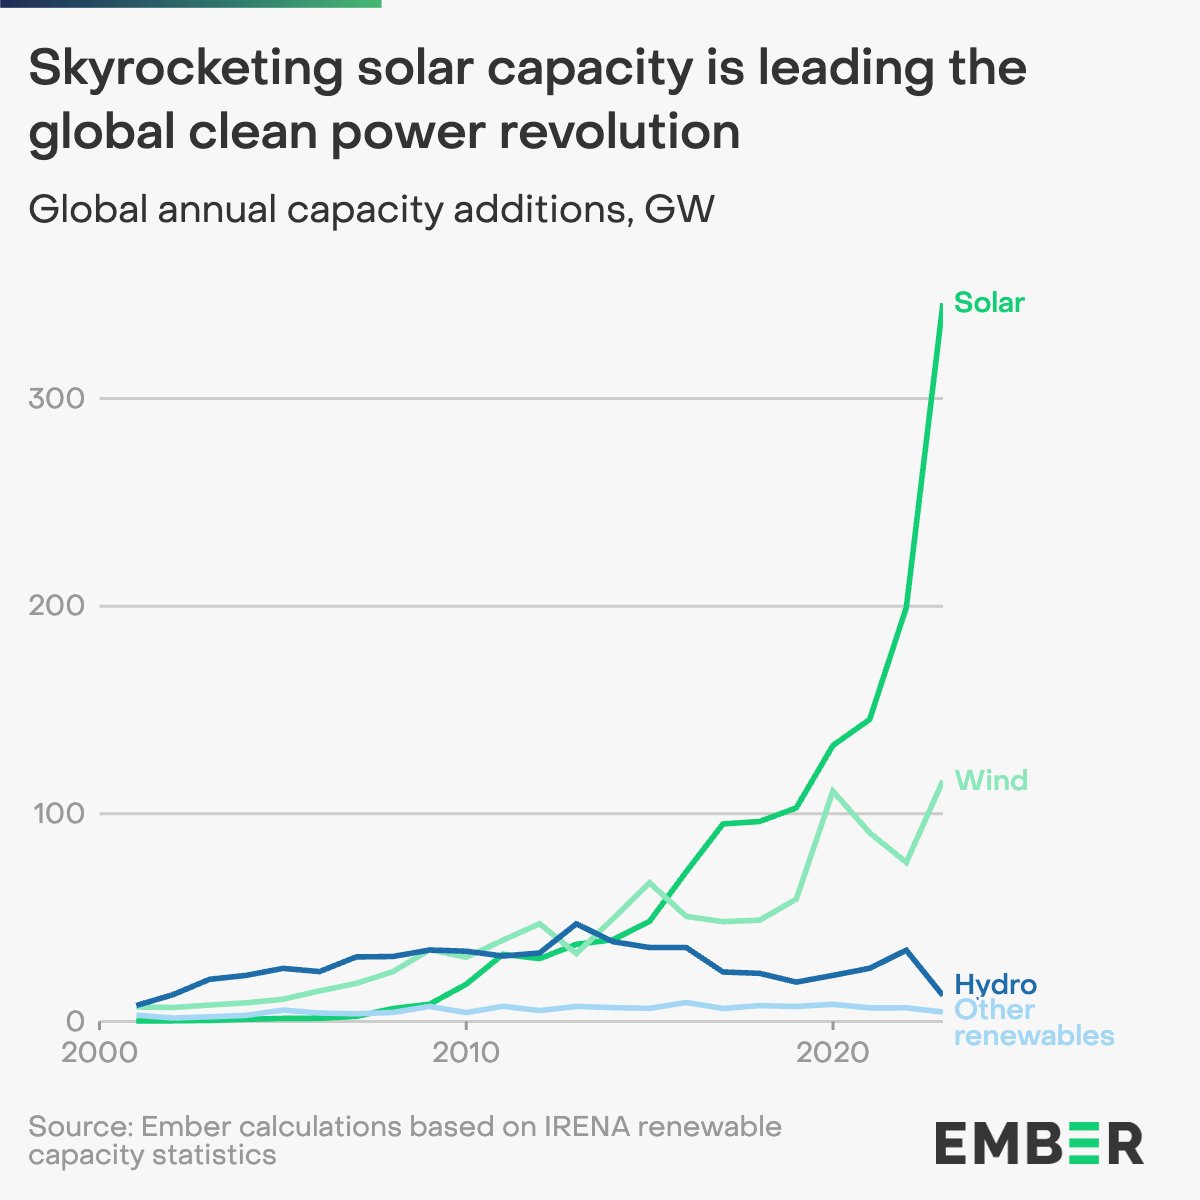
What did we find? #Wind and #solar took off!

[2/10] #GER22
ember-climate.org/insights/resea…
50 countries have now crossed the 10% #wind and #solar landmark, with 7 new countries in 2021 hitting the milestone for the first time: 🇨🇳🇯🇵🇲🇳🇻🇳🇦🇷🇭🇺🇸🇻

[3/10] #GER22
ember-climate.org/insights/resea…
3 countries switched over 8% of their total electricity demand to #wind and #solar, which directly replaced #fossilfuels.

Wind & solar:
🇳🇱 - ⬆️ 11% in 2 years
🇦🇺 - ⬆️ 9%
🇻🇳 - ⬆️ 8%

Fossil fuels:
🇳🇱 - ⬇️ 15%
🇦🇺 - ⬇️ 9%
🇻🇳 - ⬇️ 10%

[4/10] #GER22
ember-climate.org/insights/resea…
Viet Nam saw astonishing growth in #solar as it increased generation by 337% (+17 TWh) in a year, to become the world’s 10th largest solar generator.

Even as demand grew, Viet Nam reduced its #fossilfuel share & drove emissions down by 6%.

[5/10] #GER22
ember-climate.org/insights/resea…
However, we also found that electricity demand rebounded, leading to a record rise in #CO2 and #coal.

Coal power rose 9% in 2021 to 10,042 TWh, the biggest percentage rise on record since at least 1985.

[6/10] #GER22
ember-climate.org/insights/resea…
All-time #coal power records were set in China and India in 2021, and also in other Asian countries: 🇰🇿🇲🇳🇵🇰🇵🇭🇮🇩

[7/10] #GER22
ember-climate.org/insights/resea…
Record rise in #coal + modest rise in #gas means power sector emissions rose by 7% (778 million tonnes) in 2021, the largest absolute rise ever.

To reach @IEA 1.5 degrees pathway, power sector emissions need to fall 60% from 2021 to 2030.

[8/10] #GER22
ember-climate.org/insights/resea…
Leaders in #wind and #solar show that huge growth is realistic and can happen relatively quickly.

But shifts aren’t happening fast enough across all countries. Wind and solar need to sustain high growth rates for 1.5 degrees.

[9/10] #GER22
ember-climate.org/insights/resea…
To be on a pathway that keeps global heating to 1.5 degrees, #wind and #solar needs to sustain high growth rates of 20% every year to 2030.

[10/10] Full report: Global Electricity Review #GER22
ember-climate.org/insights/resea…

• • •

Missing some Tweet in this thread? You can try to force a refresh
 

Keep Current with Ember

Ember Profile picture

Stay in touch and get notified when new unrolls are available from this author!

Read all threads

This Thread may be Removed Anytime!

PDF

Twitter may remove this content at anytime! Save it as PDF for later use!

Try unrolling a thread yourself!

how to unroll video
  1. Follow @ThreadReaderApp to mention us!

  2. From a Twitter thread mention us with a keyword "unroll"
@threadreaderapp unroll

Practice here first or read more on our help page!

More from @EmberClimate

May 30
Solar surged in 2023 📈

74% more solar was installed in 2023 than in 2022, the fastest percentage rise since 2011.

Based on @IRENA’s renewable capacity data, we present six charts that explain 2023’s record solar surge. Key highlights in a #thread Image
China is in the lead:

☀️China installed 55% more solar capacity than the previous year 📈x4.5 faster than the G7 (+12%)

🌬️China installed 21% more wind capacity than the previous year 📈x4.6 faster than the G7 (+4.5%) Image
Solar’s explosive growth is not just about China

28 countries built more than 1 GW of new solar capacity in 2023 Image
Read 7 tweets
Apr 8
NEW from Ember electricity data:

Electricity demand has stabilised in the EU, but fossil generation keeps falling ⚡🇪🇺 1/4 Image
Last winter, some months showed increases in EU electricity demand for the first time in two years 2/4 Image
However, fossil generation keeps falling as clean generation surges. Some highlights from Q1 2024:

🌪️ Wind generation was up 9%
☀️ Solar is generating more, even in winter months
🌊 Hydro generation rebounded
🇫🇷 Nuclear was up in France

3/4
Image
Image
Read 4 tweets
Aug 16, 2023
With its proposed mines, #Whitehaven will double its #methane pollution over the next decade, releasing >1 million tonnes of methane by 2050 according to our latest data.

The climate impact is worse than the annual emissions of an additional 56 million cars🚗.

A thread 🧵(1/6) Image
“This flies in the face of Australia’s climate commitments and asks serious questions about the amount of risk these expansion plans pose,” says @Chris_climate_., Climate Strategy Advisor at Ember. (2/6)

#Whitehaven #methane

https://t.co/Ty8SBLa2zeember-climate.org/insights/resea…
Image
Ember also finds that across Whitehaven’s coal mines, there are clear transparency gaps concerning the existing methane estimates. (3/6)

#Whitehaven #methane

https://t.co/OhTG6BT5CCember-climate.org/insights/resea…
Image
Read 6 tweets
Aug 2, 2023
#Methane is a powerful greenhouse gas that often goes unnoticed in climate discussions.

But cutting methane emissions - especially those from coal mines - is the strongest lever we have to slow #climatechange in the short-term.

A 🧵 (1/5): Image
Methane has a short-term climate impact 82.5 times larger than CO2, and #coalmines are a big source of it.

Methane is embedded in coal seams and surrounding rock strata. It is emitted before, during and long after the mining process.

2/5
Only four countries - China, Russia, Indonesia and India - are responsible for 76% of global coal mine methane emissions.

And only nine countries are responsible for 90% of emissions.

3/5 Image
Read 5 tweets
Mar 17, 2023
BREAKING | Solar and wind dominate 🇮🇳India’s electricity capacity additions in 2022.

92% of India's total added capacity comprises wind and solar, while coal accounted for only 5% last year.

🧵1/4

ember-climate.org/insights/resea…

#IndiaRES
In 2022, India added:
☀️ 13.9 GW of solar capacity
🌪️ 1.8 GW of wind capacity

In total, the country added 15.7 GW of new capacity, 17% above additions in 2021. This is comparable to the UK’s entire solar fleet as of 2021.

🧵2/4

ember-climate.org/insights/resea…

#IndiaRES
Rajasthan & Gujarat are the top two states, adding the most renewable capacity in 2022.

⚡ Rajasthan added 6.7 GW of solar & wind
⚡ Gujarat added 3.1 GW of solar & wind

This is expected to continue growing, given their ambitious 2030 targets.

🧵3/4

ember-climate.org/insights/resea…
Read 4 tweets
Oct 13, 2022
Putin’s war accelerates the EU’s fossil fuel detox

Article by @POLITICOEurope with data from our new EU 2030 targets tracker (see🧵)

politico.eu/article/vladim…
NEW | EU Power Sector 2030 Targets Tracker

Tracking the latest renewables, fossil and clean electricity targets of European countries.

ember-climate.org/data/data-tool…
1/ EU-27 clean electricity targets for 2030

ember-climate.org/data/data-tool…
Read 6 tweets

Did Thread Reader help you today?

Support us! We are indie developers!


This site is made by just two indie developers on a laptop doing marketing, support and development! Read more about the story.

Become a Premium Member ($3/month or $30/year) and get exclusive features!

Become Premium

Don't want to be a Premium member but still want to support us?

Make a small donation by buying us coffee ($5) or help with server cost ($10)

Donate via Paypal

Or Donate anonymously using crypto!

Ethereum

0xfe58350B80634f60Fa6Dc149a72b4DFbc17D341E copy

Bitcoin

3ATGMxNzCUFzxpMCHL5sWSt4DVtS8UqXpi copy

Thank you for your support!

Follow Us!

:(