Data from the @TaiwanCDC confirm that #COVID19 vaccines help against #Omicron.
Specifically, the rate of death decreases with each additional vaccine dose, for every age group in the population.
This is despite numerous assumptions biased against vaccine effectiveness.
1/13
Specifically, the rate of death decreases with each additional vaccine dose, for every age group in the population.
This is despite numerous assumptions biased against vaccine effectiveness.
1/13

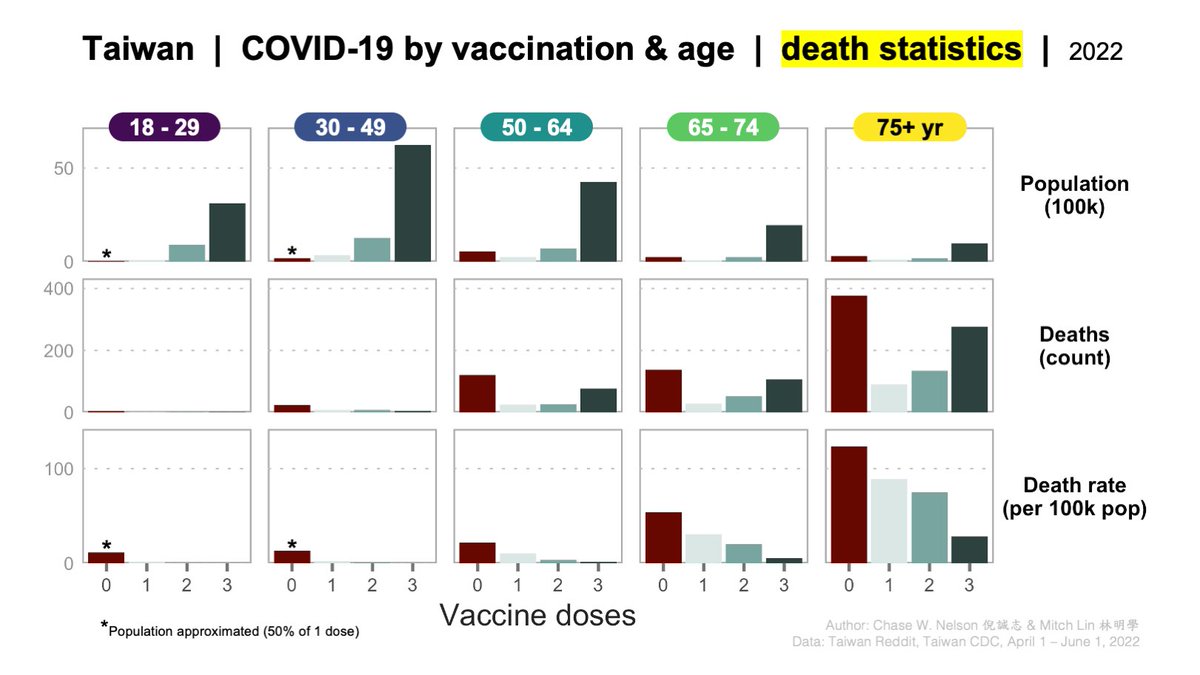
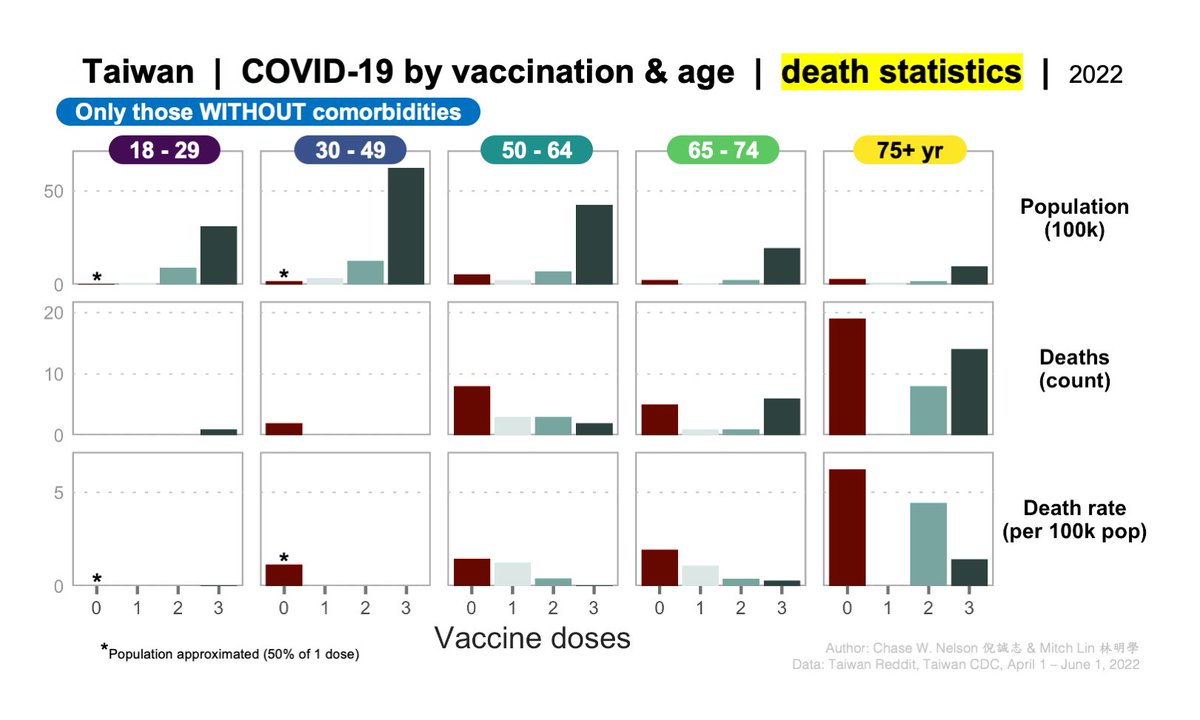
First, consider the population of Taiwan, stratified by age and vaccination status. The single largest group is 30-49 year-olds with 3 doses (dark green).
This is the pattern of deaths one would expect if deaths were random, i.e., if both vaccination and age had no effect.
2/13
This is the pattern of deaths one would expect if deaths were random, i.e., if both vaccination and age had no effect.
2/13

Second, consider the observed deaths. The single largest group is 75+ year-olds with 0 doses.
Thus, the observed pattern of deaths differs drastically from random expectation.
For example, 75+ year-olds with 0 doses are a small demographic but dominate the deaths.
3/13
Thus, the observed pattern of deaths differs drastically from random expectation.
For example, 75+ year-olds with 0 doses are a small demographic but dominate the deaths.
3/13

Last, dividing deaths (middle) by population (top) yields population death rates (bottom).
Deaths are occurring at higher rates in the unvaccinated than in the boosted for all ages:
▶️12x higher for 50-64
▶️10x for 65-74
▶️4.3x for 75+
It's also clear that each dose helps.
4/13
Deaths are occurring at higher rates in the unvaccinated than in the boosted for all ages:
▶️12x higher for 50-64
▶️10x for 65-74
▶️4.3x for 75+
It's also clear that each dose helps.
4/13
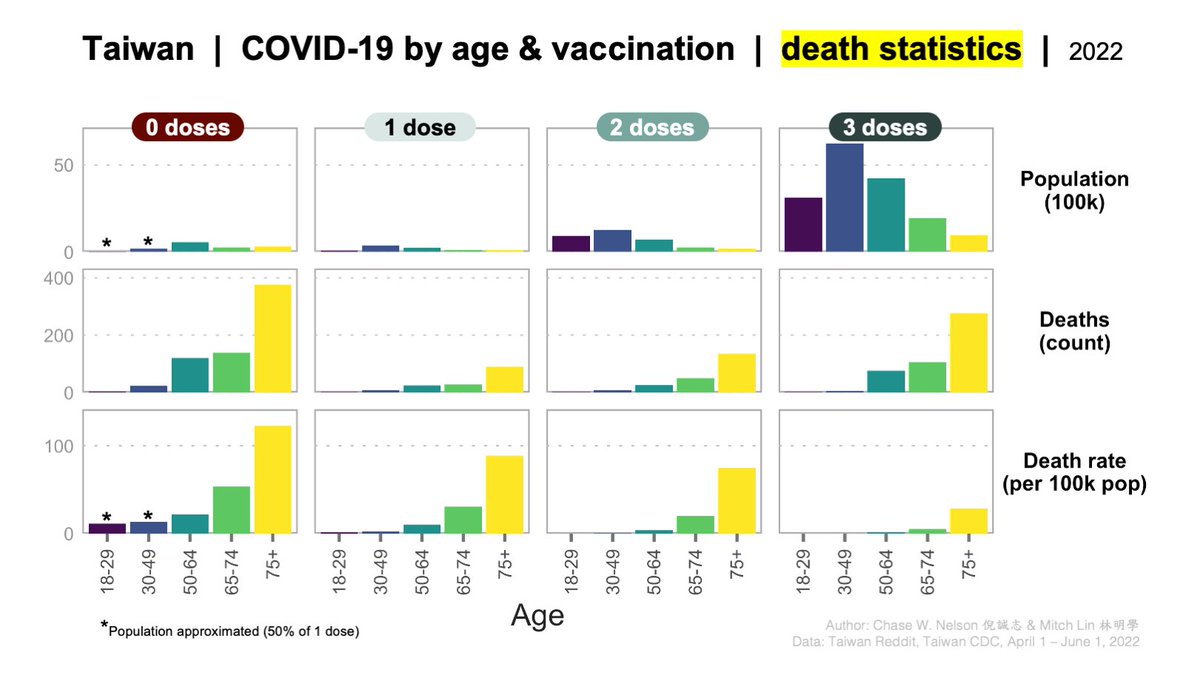
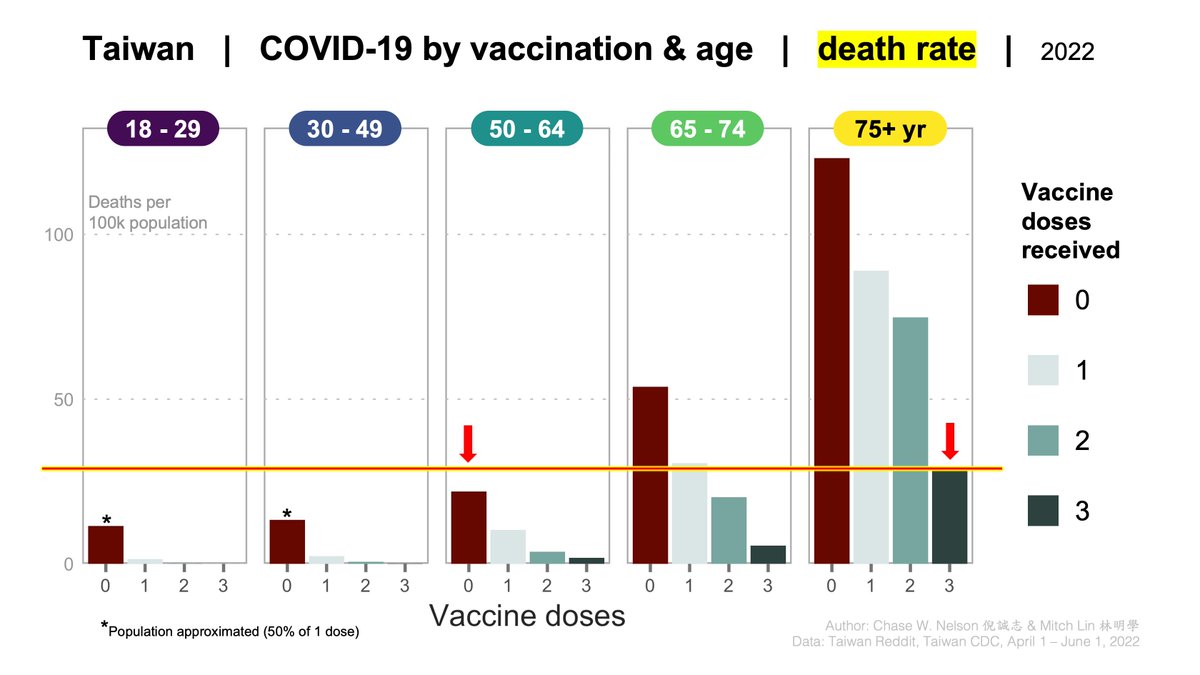
The same data can be rearranged to highlight the age effect.
Within each vaccination category, the death rate increases with age (bottom).
Note that the elderly remain at considerable risk even if vaccinated. This is one reason to limit viral spread.
5/13
Within each vaccination category, the death rate increases with age (bottom).
Note that the elderly remain at considerable risk even if vaccinated. This is one reason to limit viral spread.
5/13
ASSUMPTIONS. Data from the @Taiwan_CDC are provided with arbitrary age categories. Unfortunately, categories used for POPULATION and VACCINATION (e.g., '75+') differ from those used for DEATHS (e.g., '70s' and '80s').
Thus, it was necessary to make several approximations.
6/13
Thus, it was necessary to make several approximations.
6/13
All assumptions and approximations were made in such a way as to make vaccines seem LESS effective overall:
1⃣AMBIGUOUS ages for deaths were placed in the next LOWER age group: all '60s' were placed in the 55-64 group and all '70s' were placed in the '65-74' group.
7/13
1⃣AMBIGUOUS ages for deaths were placed in the next LOWER age group: all '60s' were placed in the 55-64 group and all '70s' were placed in the '65-74' group.
7/13
2⃣all deaths with MISSING DATA for age or vaccination were excluded. This would likely disproportionately exclude older individuals and those in poor health, biasing death rates low in general, and elderly/unvaccinated death rates low in particular.
8/13
8/13
3⃣the NUMBER OF UNVACCINATED 18-29 and 30-49 year-olds was set to 50% of those same ages with 1 dose. This was necessary because these demographics are statistically indistinguishable from 0 given outdated census data from the CDC.
9/13
9/13
4⃣death rates were calculated PER POPULATION, not case — they are NOT case fatality rates (CFRs).
This was necessary because @TaiwanCDC does not provide case counts stratified by age, vaccination, and comorbidities. However, we know cases aren't randomly distributed.
10/13
This was necessary because @TaiwanCDC does not provide case counts stratified by age, vaccination, and comorbidities. However, we know cases aren't randomly distributed.
10/13
LIMITATIONS:
▶️comorbidities & sex could not be controlled
▶️comorbid may be more/less likely to vaccinate or take risks
▶️vaccinated may be more/less likely to take risks
▶️vaccination rates are a changing metric
▶️vaccination also limits transmission, illness, long COVID
11/13
▶️comorbidities & sex could not be controlled
▶️comorbid may be more/less likely to vaccinate or take risks
▶️vaccinated may be more/less likely to take risks
▶️vaccination rates are a changing metric
▶️vaccination also limits transmission, illness, long COVID
11/13
Despite these assumptions, results are similar to those published by Gary Wu in @CWM_en, where daily fatality data over a ~2.5 week period suggested that unvaccinated 70+ year-olds were dying at a rate 4.5 times higher than those who were boosted.
12/13
12/13
https://twitter.com/CWM_en/status/1526510337016487936
In summary, even when making many assumptions biased against vaccine effectiveness, Taiwan COVID death data offer a clear demonstration that
1) each vaccine dose offers extra protection
2) risk increases with age
3) risk to the unvaccinated is not negligible for any age
13/13 ▪️
1) each vaccine dose offers extra protection
2) risk increases with age
3) risk to the unvaccinated is not negligible for any age
13/13 ▪️
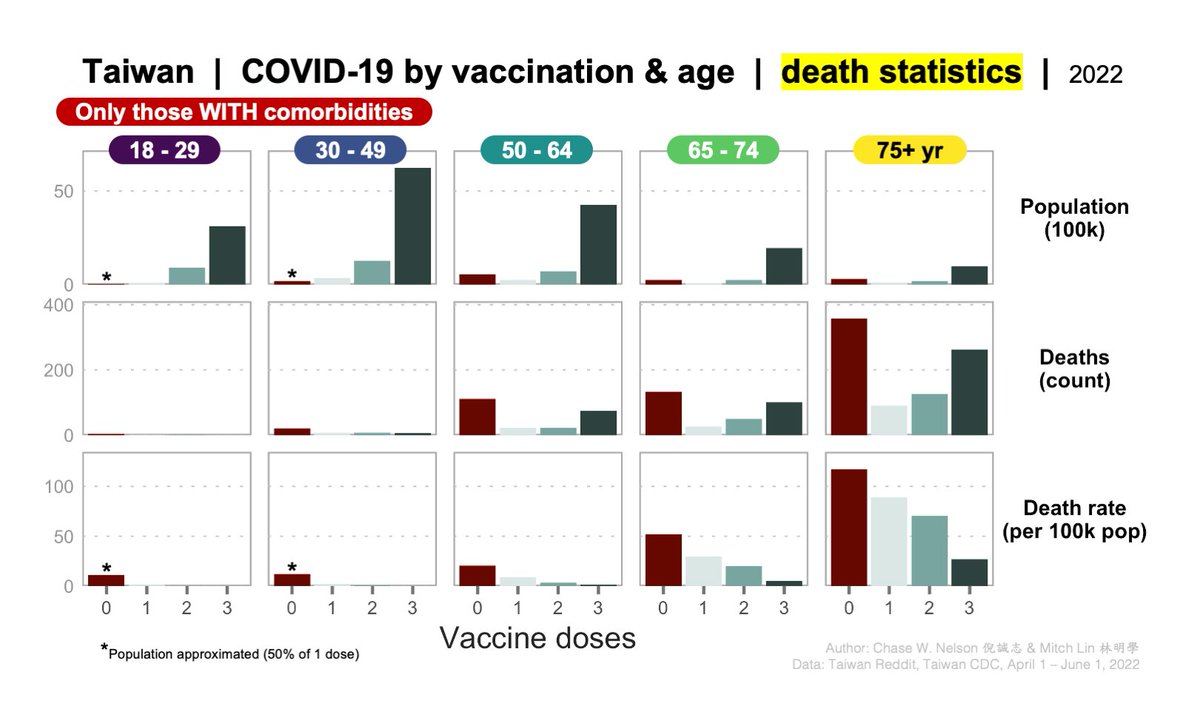
COMORBIDITIES: excellent point! As stated in tweet 11/13, this is a limitation.
We can control for them in a simple way by separately analyzing deaths with and without them, as below.
All patterns hold—in fact are mostly stronger—within both groups.
+1
We can control for them in a simple way by separately analyzing deaths with and without them, as below.
All patterns hold—in fact are mostly stronger—within both groups.
+1
https://twitter.com/FelipeMonteroM/status/1532011739977744384
Other considerations:
1) it's unclear how the CDC is defining comorbidities
2) if 0 dose deaths in the pooled data are mostly comorbid, a pattern is still evident in doses 1-3
3) comorbid may be more (or less) likely to vaccinate, but also to take risks, shelter in place, etc.
+2
1) it's unclear how the CDC is defining comorbidities
2) if 0 dose deaths in the pooled data are mostly comorbid, a pattern is still evident in doses 1-3
3) comorbid may be more (or less) likely to vaccinate, but also to take risks, shelter in place, etc.
+2
One advantage of using #Taiwan data to estimate vaccine effectiveness against Omicron is that this is the country's first real outbreak.
Thus, there is virtually no natural immunity to dilute the signal of vaccination.
+3
Thus, there is virtually no natural immunity to dilute the signal of vaccination.
+3
https://twitter.com/ValentinThoss/status/1532284027490942976
As pointed out by @AltenbergLee, if you draw a line at the death rate for 3-dose 75+ year-olds, it's higher than 0-dose 50-64'ers.
Some folks have vaccinated all they can, but remain at risk.
Acts like mask wearing remain compassionate & important. 👇
+4
Some folks have vaccinated all they can, but remain at risk.
Acts like mask wearing remain compassionate & important. 👇
+4
https://twitter.com/AltenbergLee/status/1532107917607849984
• • •
Missing some Tweet in this thread? You can try to
force a refresh