7 Tips Every Trader Should Know✊
Whether you're a🐂or a🐻, everyone should have their own set of rules to follow. You're trading plan is your guide to success. Here are 7 tips I've learned to live by, and you should too. #Bitcoin #SPY #ETH #Crypto
🧵👇
Whether you're a🐂or a🐻, everyone should have their own set of rules to follow. You're trading plan is your guide to success. Here are 7 tips I've learned to live by, and you should too. #Bitcoin #SPY #ETH #Crypto
🧵👇

1. Establish a plan!💯
Plan your trades carefully before you enter a position. This means having the price you want to enter, a stop loss, and a take profit zone BEFORE you enter a position. If you aren't doing this, you're probably losing money.💸
Plan your trades carefully before you enter a position. This means having the price you want to enter, a stop loss, and a take profit zone BEFORE you enter a position. If you aren't doing this, you're probably losing money.💸

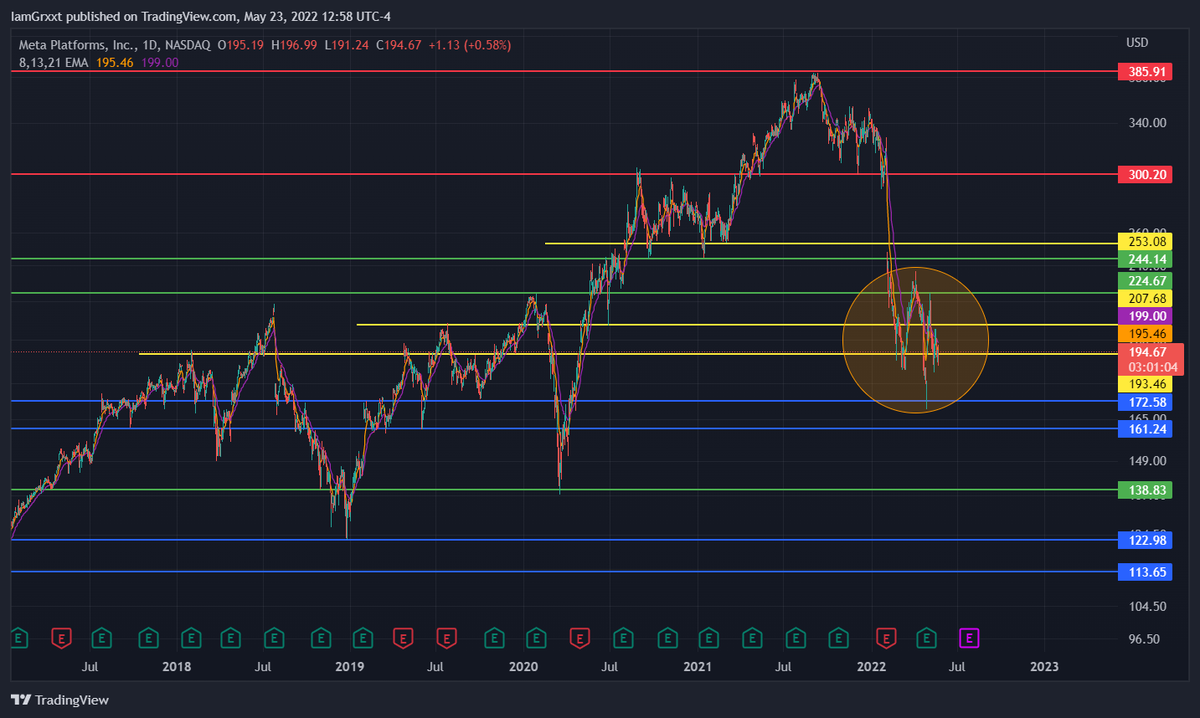
2. Protect your capital!🪙
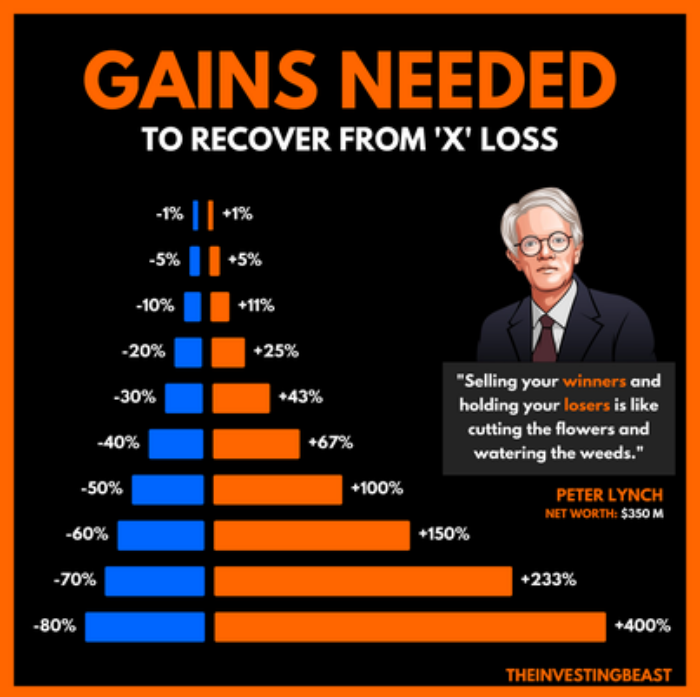
Cut losses quickly. Don't hold and hope, it will 9/10 create bigger losses. If you're plan says to cut at 5% loss, cut it without exceptions, EVERYTIME!
Here's a chart that shows what it would take to recover funds at certain levels of loss.
Cut losses quickly. Don't hold and hope, it will 9/10 create bigger losses. If you're plan says to cut at 5% loss, cut it without exceptions, EVERYTIME!
Here's a chart that shows what it would take to recover funds at certain levels of loss.
3.Focus on a few.
Don't spread yourself thin by trying to trade too many markets. If you try to follow and trade too many, you won't be able to give any of them the time and attention required to to trade them successfully.
Don't spread yourself thin by trying to trade too many markets. If you try to follow and trade too many, you won't be able to give any of them the time and attention required to to trade them successfully.

4. Pace yourself.
If you're new to trading, there's no reason to go crazy and put your whole account into multiple trades at the same time. Try one or two, with small amounts, and spread them out. Let trades come to you. If you are feeling overwhelmed, take a break. Baby steps.
If you're new to trading, there's no reason to go crazy and put your whole account into multiple trades at the same time. Try one or two, with small amounts, and spread them out. Let trades come to you. If you are feeling overwhelmed, take a break. Baby steps.

5. Be willing to go long or short
Market's can change at the drop of a hat. If you're too bias one way for too long, you'll get #REKT. The trend is your friend. If it starts changing, wait a day or two to see if it really is. If it is, get ready to go the other way.
Market's can change at the drop of a hat. If you're too bias one way for too long, you'll get #REKT. The trend is your friend. If it starts changing, wait a day or two to see if it really is. If it is, get ready to go the other way.

6. Learn from losses.
You will encounter losses. I have losses, I have had BIG losses. Anyone who tells you they don't is lying. Humility goes a long way to actually learning something new. Failure is required to become better in every aspect of life. Trading is no different.
You will encounter losses. I have losses, I have had BIG losses. Anyone who tells you they don't is lying. Humility goes a long way to actually learning something new. Failure is required to become better in every aspect of life. Trading is no different.

7. Be patient.
Don't become so emersed into the markets that you lose sight of the bigger picture. You can't focus on every little uptick or downtick in the market. You'll drive yourself insane. Try to keep a longer term perspective even when day trading.💪
Don't become so emersed into the markets that you lose sight of the bigger picture. You can't focus on every little uptick or downtick in the market. You'll drive yourself insane. Try to keep a longer term perspective even when day trading.💪

If you're looking for a place to hang out and learn about technical analysis, charting, and trading, you can come hang out with me and other like-minded traders in #DeFi Dojo on Discord. I also do one on one sessions. The link to Calendy is in my bio.
discord.gg/767H9zzTaf
discord.gg/767H9zzTaf
• • •
Missing some Tweet in this thread? You can try to
force a refresh