
🧵I FOUND OUT WHERE #BITCOIN WILL BOTTOM!
A secret untold story that nobody is talking about
After reading this thread, you'll be 1 in a Million to know about this 💎
🔹 Metals correlation
🔹 DXY correlation
🔹 Copper sharp drops
🔹 Technicals
🔹 Fundamentals
1/28
A secret untold story that nobody is talking about
After reading this thread, you'll be 1 in a Million to know about this 💎
🔹 Metals correlation
🔹 DXY correlation
🔹 Copper sharp drops
🔹 Technicals
🔹 Fundamentals
1/28

Now that I got your attention let's dig in
Many people are aware of the SPX & #BTC correlation but I believe the best asset correlation to be used for #Bitcoin is METALS & $DXY
Mainly Copper & Silver
And the root cause of it all is the Dollar & the FED policy of course 👇
2/
Many people are aware of the SPX & #BTC correlation but I believe the best asset correlation to be used for #Bitcoin is METALS & $DXY
Mainly Copper & Silver
And the root cause of it all is the Dollar & the FED policy of course 👇
2/

🔹 Metals correlation
It's kinda crazy when u see it first and think why is nobody seeing this
I've pointed out the correlation with Copper first and marked each significant cycle low & bottom.
You can see how closely they correlate to each other on the Higher Timeframes
3/
It's kinda crazy when u see it first and think why is nobody seeing this
I've pointed out the correlation with Copper first and marked each significant cycle low & bottom.
You can see how closely they correlate to each other on the Higher Timeframes
3/

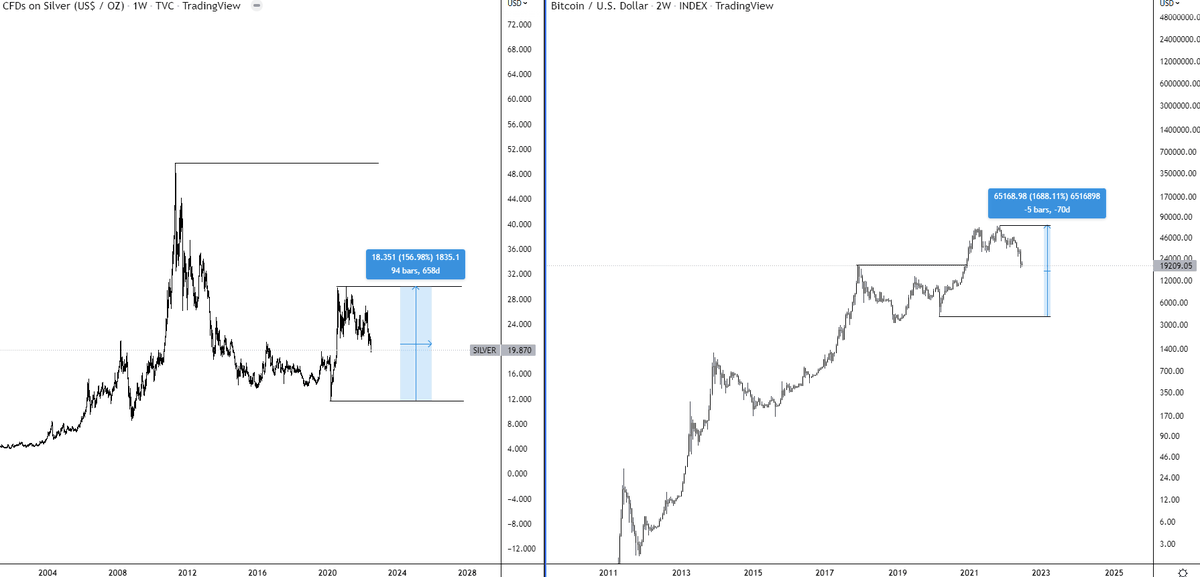
Now you might've seen me talk about the correlation with Silver a few times as well in the past
So let's add Silver to the equation & we see a similar thing. We see the same HTF correlation which confirms our case
4/
So let's add Silver to the equation & we see a similar thing. We see the same HTF correlation which confirms our case
4/

Here is where I first mentioned it vs how it has advanced so far
5/
https://twitter.com/i_am_jackis/status/1492447286470844416
5/

You can put others in and find the same story.
Each one has its own metrics and therefore slightly different, yet similar outcome
We can confirm the correlation is there and therefore by combining all the assets, we can find the outcomes for them together.
6/
Each one has its own metrics and therefore slightly different, yet similar outcome
We can confirm the correlation is there and therefore by combining all the assets, we can find the outcomes for them together.
6/

🔹 DXY correlation
But the root cause of it all is the Dollar and the FED policy on QE/QT & interest rates
Where DXY goes, the others follow
Now if we put #DXY & #BTC together we won't find that many similarities but if we invert the chart and adjust the scale a bit. VOILA
7/
But the root cause of it all is the Dollar and the FED policy on QE/QT & interest rates
Where DXY goes, the others follow
Now if we put #DXY & #BTC together we won't find that many similarities but if we invert the chart and adjust the scale a bit. VOILA
7/

Here we can see the clear picture of the Market tops & bottoms.
The only difference is that Bitcoin is a new approaching asset and therefore its strength sends us much higher each cycle vs other assets
8/
The only difference is that Bitcoin is a new approaching asset and therefore its strength sends us much higher each cycle vs other assets
8/


With this confirmed correlation we can clearly say #Bitcoin is treated as a newly found commodity in the digital area in a digital space.
To further validify this observation even the head from the #SEC, Gary Gensler of the "opposition side" has confirmed this
9/
To further validify this observation even the head from the #SEC, Gary Gensler of the "opposition side" has confirmed this
9/

So with this confirmed to know where the bottom for #Bitcoin is going to be is to look where the bottom for #Silver & #Copper & #DXY and other correlated assets is going to be.
It's that simple.
We will look at both Technical & Fundamental narrative.
10/
It's that simple.
We will look at both Technical & Fundamental narrative.
10/
🔹 Copper sharp drops
One thing to point out is when there was a recession capitulation, Copper prices were falling down a lot in a down-only manner & each time that happened it marked the bottom soon after
2008/9, Covid, & Now again
11/
One thing to point out is when there was a recession capitulation, Copper prices were falling down a lot in a down-only manner & each time that happened it marked the bottom soon after
2008/9, Covid, & Now again
11/

🔹 Technicals
From a TA perspective, we are now approaching the biggest demand zone in years for Copper on the Monthly chart.
The similar one we approached in 2008, which has marked the bottom after a down-only move.
The same level we are also approaching on Silver
12/
From a TA perspective, we are now approaching the biggest demand zone in years for Copper on the Monthly chart.
The similar one we approached in 2008, which has marked the bottom after a down-only move.
The same level we are also approaching on Silver
12/


These demand zones will be heavily defended so if we agree the correlation is indisputable and that these demand zones are gonna hold for metals (more on that later), what does that imply for #Bitcoin?
It implies we will be bottoming in the area between 20-14K apx
13/
It implies we will be bottoming in the area between 20-14K apx
13/

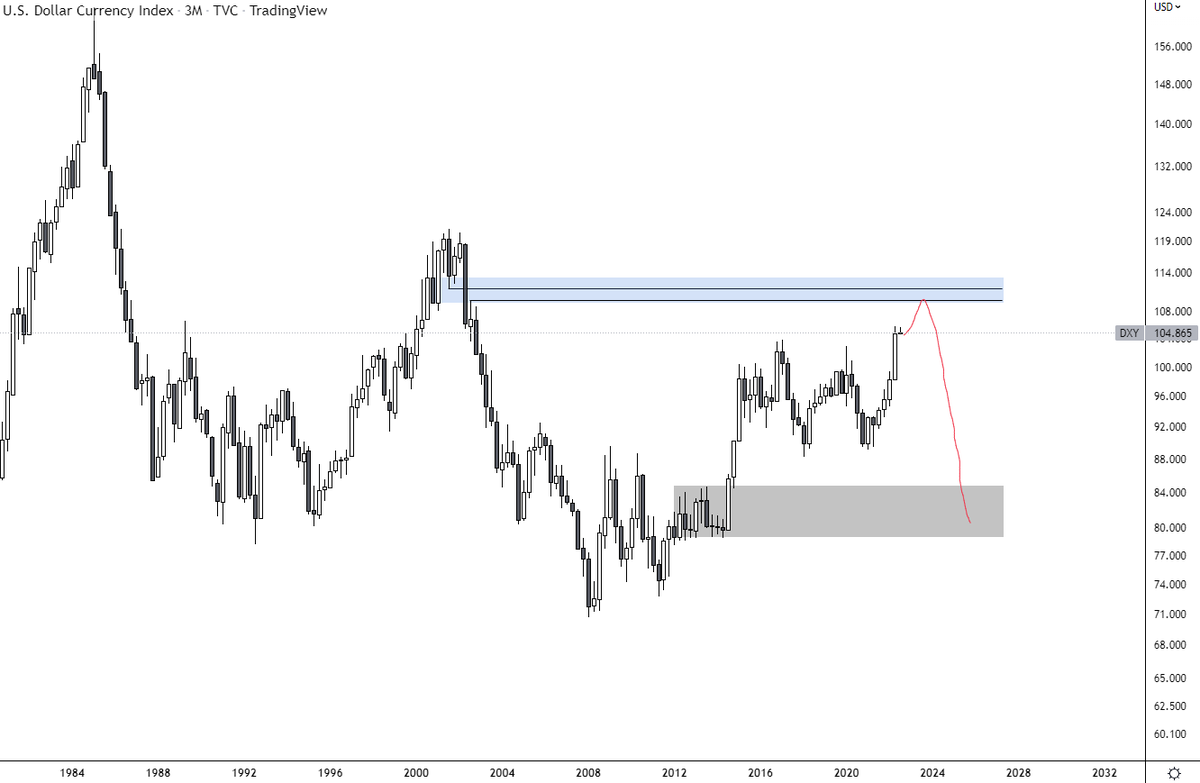
Now if we see High Timeframe supports across the board, therefore we should see a HTF resistance on DXY. And truly we do.
All after a big rally this year on the QT, rate hikes & war news, and in general, fight the inflation policy
After all that settles, DXY will go back.
14/
All after a big rally this year on the QT, rate hikes & war news, and in general, fight the inflation policy
After all that settles, DXY will go back.
14/
🔹 Fundamentals
Now I understand many of you ask yourself a question, but J what if all Silver, Copper & therefore also BTC just keeps going down & DXY up?
And that's a very valid question and I think the answer can be found in a rather simple realization
15/
Now I understand many of you ask yourself a question, but J what if all Silver, Copper & therefore also BTC just keeps going down & DXY up?
And that's a very valid question and I think the answer can be found in a rather simple realization
15/
The world has realized that we are running on a system with unlimited supply (fiat currency) & limited commodities such as food, oil, BTC, silver & so on
After the initial panic this year, what do you think everyone will try to gather? The unlimited stuff? Or the scarce?
16/
After the initial panic this year, what do you think everyone will try to gather? The unlimited stuff? Or the scarce?
16/

The world more than ever is starting to appreciate stuff that is scarce
Therefore the real question you should ask is:
Will Copper, Silver & other stuff go lower? Will they break their multi-year support on a world demand? If the answer is no, the same is expected for BTC
17/
Therefore the real question you should ask is:
Will Copper, Silver & other stuff go lower? Will they break their multi-year support on a world demand? If the answer is no, the same is expected for BTC
17/
And the reason why I do not expect the prices to lose their multi-year support is that if they have, they'd lose the Covid lows which would break the HTF market structure and I do not see that happening
I think we see a new ATH on Silver, Copper, and so on in the future
18/
I think we see a new ATH on Silver, Copper, and so on in the future
18/

If we can agree on that as well then the last question is
If that's all true why not just buy Silver, Copper or others? Why BTC?
Well as always the best option is diversification and you can't go wrong. Duh
But from a max Risk to Reward point of view, BTC is the winner 👇
19/
If that's all true why not just buy Silver, Copper or others? Why BTC?
Well as always the best option is diversification and you can't go wrong. Duh
But from a max Risk to Reward point of view, BTC is the winner 👇
19/

It's because as I said in the beginning, it's a new appreciating asset and the world is still trying to find a proper value for it
Therefore it offers bigger moves down but also higher moves up, percentage-wise
It's the price you pay for being early & the reward it offers
20/
Therefore it offers bigger moves down but also higher moves up, percentage-wise
It's the price you pay for being early & the reward it offers
20/
And while others barely break their past cycle ATH or not at all, BTC has been doing that every time
However, in this decade of the world looking for value & scarce stuff, I believe all will break its ATH, even Silver
As we enter new era of commodity-backed monetary system
21/
However, in this decade of the world looking for value & scarce stuff, I believe all will break its ATH, even Silver
As we enter new era of commodity-backed monetary system
21/

From a local view, if we anticipate a HTF bounce, we can also anticipate the market to fill the CME gaps as it so often does and does provide a further confluence
We currently have three open ones above us, while we have filled the ones below
22/
We currently have three open ones above us, while we have filled the ones below
22/

If you are looking for more Bitcoin solely evidence I highly recommend reading this awesome thread 🧵 by my friend @Phoenix_Ash3s where he goes deep on on-chain stuff and other interesting takes, where I'd only repeat what has already been said 👏
23/
https://twitter.com/Phoenix_Ash3s/status/1541499160440049669
23/
Also be sure to read my take on past cycle mistakes waiting for lower prices, being scared to buy & so on, that could help you big time do the right thing this time! 💎
24/
https://twitter.com/i_am_jackis/status/1536753524285050890
24/
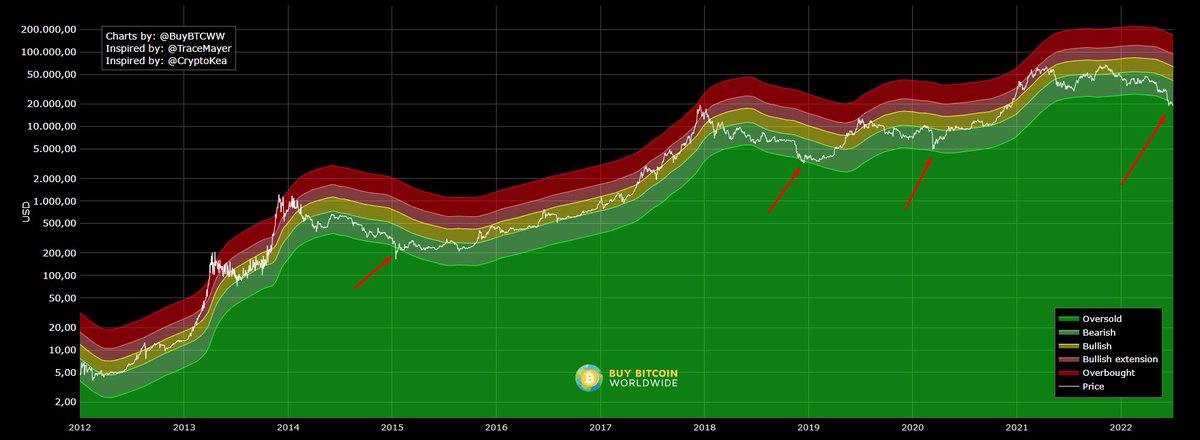
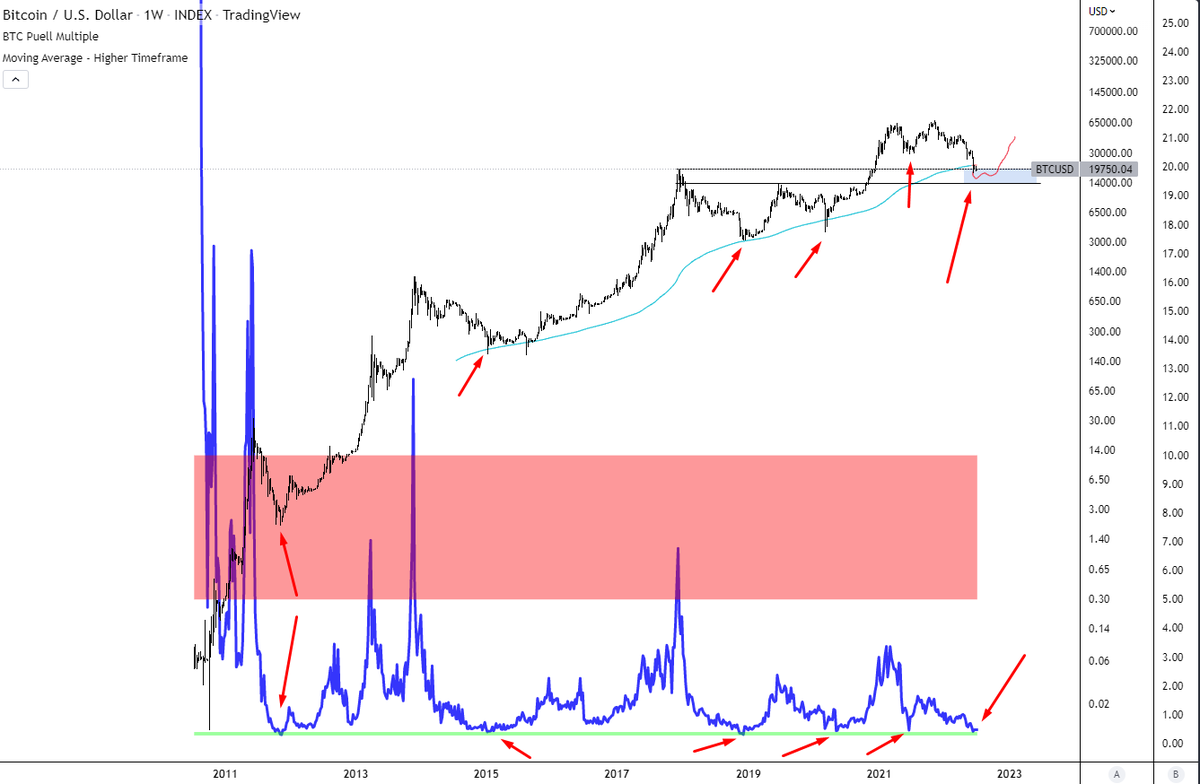
Few more interesting charts & metrics showing we are the most oversold in a long time and why this is a golden opportunity!
All by themselves wouldn't mean much but in confluence with each other and you have a clear picture
25/
All by themselves wouldn't mean much but in confluence with each other and you have a clear picture
25/

Apparently, I'm not the only one thinking we are heading into a commodity-backed system that we can mark as Bretton Woods III
There is much more info I could tell but I do not want to make this thread longer than it already is
26/
There is much more info I could tell but I do not want to make this thread longer than it already is
https://twitter.com/i_am_jackis/status/1512009897180811270
26/
Lastly, let's not forget about the fundamental bid/ask size. There are no sellers above us while so many bids got filled on this way down.
After all the panic is over & all sellers are absorbed we could see things cascade up pretty quickly
27/
After all the panic is over & all sellers are absorbed we could see things cascade up pretty quickly
https://twitter.com/brokenutxo/status/1543300205428510720
27/
Thank you for taking the time to read this! 🙌
I highly appreciate it if you Retweet this thread 🧵
Help out a brother or sister struggling in the current macro situation and share it with them.
Follow me if you'd like to see more threads like this ✅
28/
I highly appreciate it if you Retweet this thread 🧵
Help out a brother or sister struggling in the current macro situation and share it with them.
Follow me if you'd like to see more threads like this ✅
28/

• • •
Missing some Tweet in this thread? You can try to
force a refresh


