1/ Have you seen the New Non-Nutritive sweeteners paper in Cell making the rounds!?! Fantastic!
Here's a video rundown:
And this thread contains a brief tweetorial...
Here's a video rundown:
And this thread contains a brief tweetorial...
2/ This study took 120 young health people who didn't consume non-nutritive sweeteners (NNS) and broke them into 6 groups, n = 20/group
👉 Control (no supplement)
👉 Glucose
👉 Sacchrin
👉 Sucralose
👉 Aspartame
👉 Stevia
7 day baseline, 14 day exposure, and 7 day follow-up
👉 Control (no supplement)
👉 Glucose
👉 Sacchrin
👉 Sucralose
👉 Aspartame
👉 Stevia
7 day baseline, 14 day exposure, and 7 day follow-up

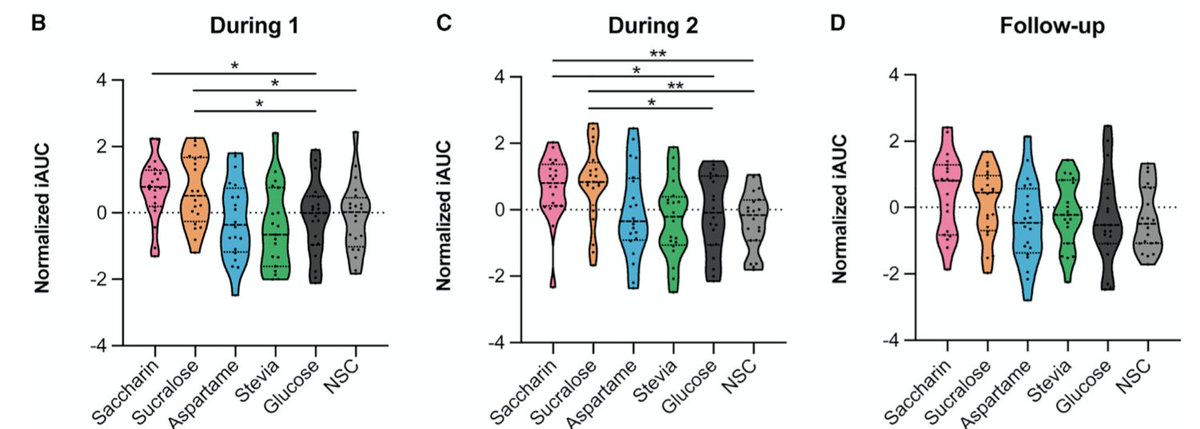
3/ There was a clear individualized response across NNS, with Sucralose and Saccharin having the largest impact on glucose tolerance on oral glucose tolerance test.
There were "responders" (who had worse glucose tolerance in response to NNS) and also non-responders.
There were "responders" (who had worse glucose tolerance in response to NNS) and also non-responders.

4/ B = week 1, C = week 2, and D = follow-up (no sweetener)
Note how the pink and orange distributions get vertically squeezed in C compared to B. This appears to suggest that, overtime, non non-responders converted to responders
Note how the pink and orange distributions get vertically squeezed in C compared to B. This appears to suggest that, overtime, non non-responders converted to responders

5/ Also, note in D (follow-up), that responders tended to revert to baseline, meaning the negative impact was reversible... PHEW!☺️ 

6/ The researchers were also able to show the effect was MEDIATED BY THE MICROBIOME
When then transferred fecal/microbiome transplants from participants to mice without microbiomes, the mice adopted the metabolic profiles of the responders/non-responders
When then transferred fecal/microbiome transplants from participants to mice without microbiomes, the mice adopted the metabolic profiles of the responders/non-responders

7/ There were many brilliant nerdy nuggets throughout the paper. I'll highlight just one
When they look at profiles of responders vs non-responders for Sucralose, a major difference the popped out was baseline #ketone (BHB) levels
Look at top row...
When they look at profiles of responders vs non-responders for Sucralose, a major difference the popped out was baseline #ketone (BHB) levels
Look at top row...

8/ Responders (impaired glucose tolerance after Sucralose) had LOW ketone [dark blue]at baseline vs. non-responders had HIGH ketone [dark red] at baseline.
Then, levels went in opposite directions after exposure to Sucralose!
What gives?!
Then, levels went in opposite directions after exposure to Sucralose!
What gives?!

9/ While they data certainly do not confirm this, one might SPECULATE, that baseline metabolic state/dietary choice (re #ketogenic diet) could influence whether one is a responder/non-responder to Sucralose, which incidentally is the sweetener in @ketochow 

10/ Speaking more broadly, I think it's possibly - if not likely - that dietary choice could influence how one responds to NNS
For example, it's previously been shown carbs + NNS might be worse than NNS alone
For example, it's previously been shown carbs + NNS might be worse than NNS alone
11/ Again, here's a link to a verbal video rundown. Certainly a stellar paper. The @Elinav_Lab group always produces incredible research! Very grateful for them!
• • •
Missing some Tweet in this thread? You can try to
force a refresh


