If you are questioning how or why anybody would even consider the possibility of a green Monthly close today for #Bitcoin, congrats on not being a blind sheep follower. You should question every trade setup before you push any buttons. Let's analyze 🧵... 

Depending on what exchange you're on, #Bitcoin had a July low of ~$18,763 and closed ~$23,322. A rally to that level would require a 15% move from here. Is that a high probability outcome? Absolutely not. More on that in a bit...
We can all agree that a one day, 15% run for #Bitcoin is ambitious, unlikely, and a bit crazy to consider.
We can also agree that PA has been crazy lately, and if any asset class has the ability to move like that, it's #Crypto.
We can also agree that PA has been crazy lately, and if any asset class has the ability to move like that, it's #Crypto.
Sure, moves like that are more characteristic of #altcoins than the almighty #BTC, but it is not out of the realm of possibilities.
Possibility doesn't = Probability (there's that word again) so let's see if we can build a case or identify a probability of this move happening.
Possibility doesn't = Probability (there's that word again) so let's see if we can build a case or identify a probability of this move happening.
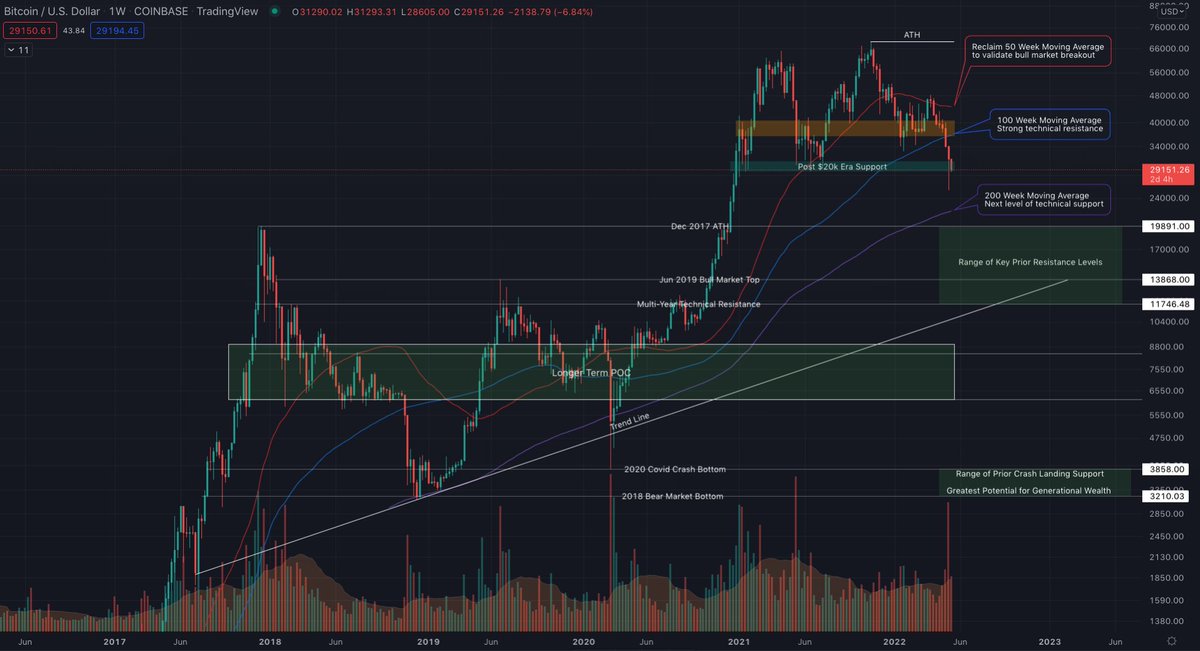
The #BTC lifetime chart shows some important history with the 200 Week Moving Average which currently has confluence with the July M close. Historically, the 200 WMA has marked bottoms. We are currently experiencing an extended period below the 200 WMA and may be due for a retest
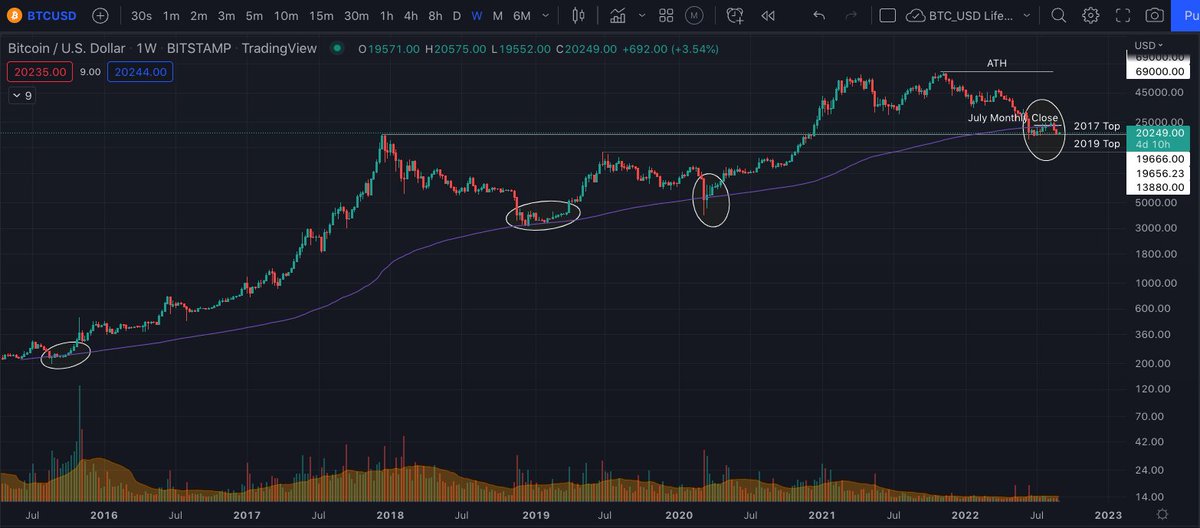
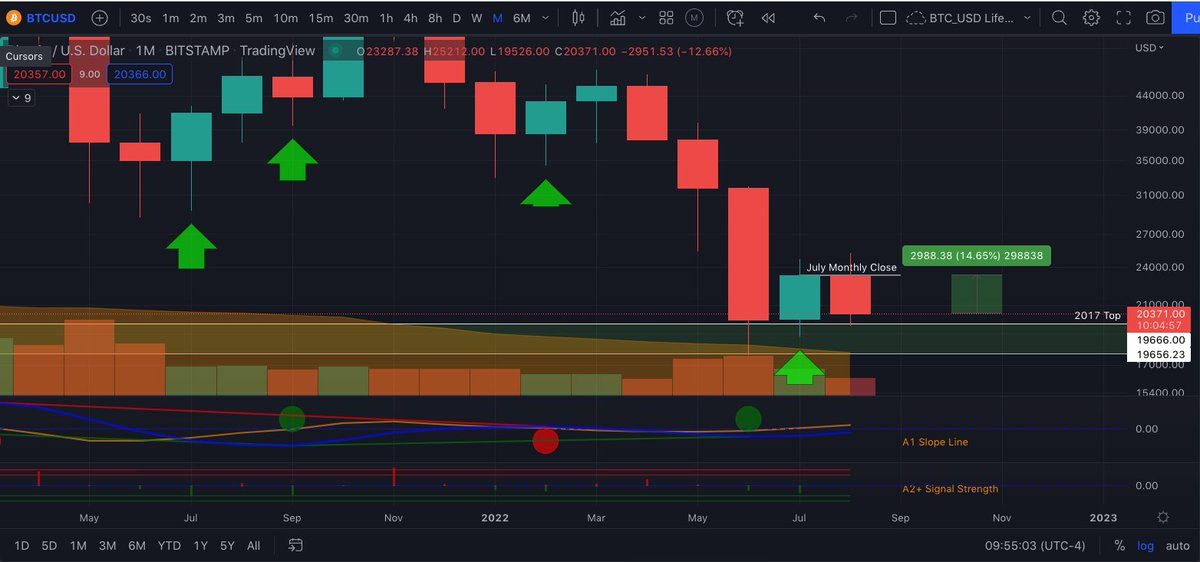
Looking at the same range of time on the M chart with the Trend Precognition A2+ Algo turned on we see that Trend Precognition has a solid performance history on monthly #tradingsignals. As a frame of reference, the ovals mark the areas where price interacted with the 200 WMA.

Of all the Monthly signals Trend Precognition has printed over #BTC's history, the one at Dec '18 bottom is worth a closer look. The Nov '18 low was $3122 and closed at $3693. The Dec '18 candle high of $4112 technically made the signal valid, but it fell short of a green close.

We seem to be in a similar situation now. Perhaps it's a coincidence that both the Nov '18 and the July '22 Trend Precognition #tradingsignals resulted in a +33% swing, but the real issue now is what the probability is of a green M close for August?

It's important to note that @tradingview imposes a 1 candle lag before printing a confirmed signal and that weak signals can flash off and on until printed or invalidated at the close. The July Trend Precognition signal has held all month, but a dump below $18.5k would invalidate

If we take a deeper dive, we can actually start to identify the probability of signal's accuracy. By looking at the Trend Precognition A2+ algos signal strength meter, we can see a Probability Score above 33% has been assigned to both the Nov '18 and the Dec '22 signals.

The Probability Score has no relationship to the amplitude of the move, merely the probability of the outcome. In this case there was a 33.40% chance that #BTC would move higher than the July low, which has already happened. The fact that it was a 33% move is pure coincidence.

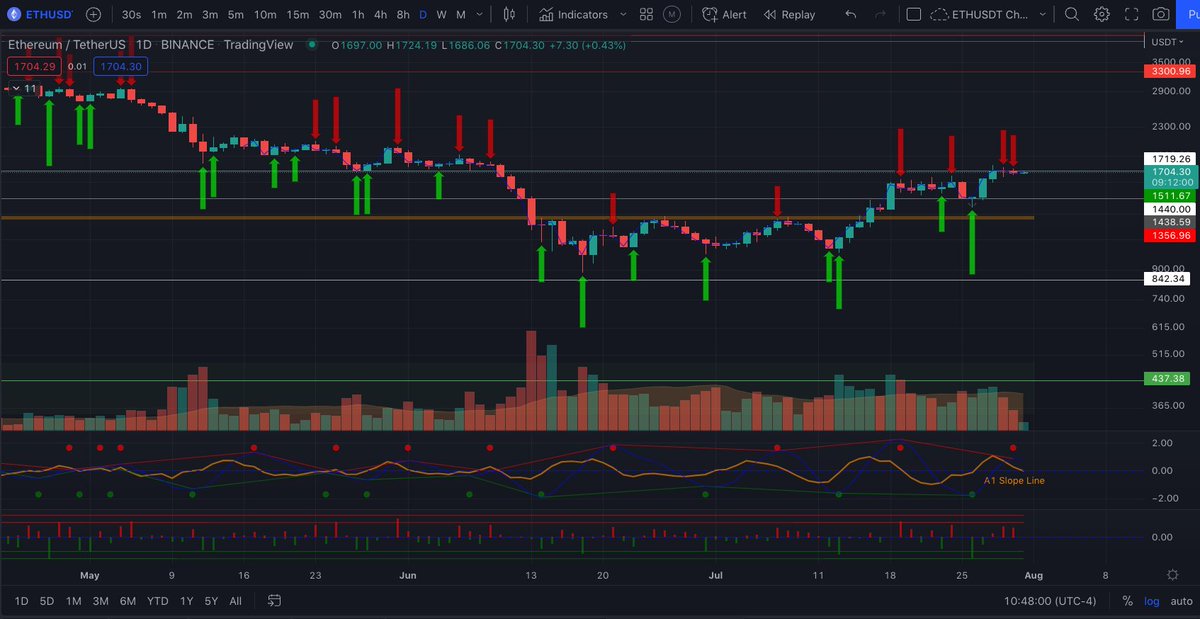
At this point we already know the Trend Precognition A2+ algo predicted a 33.4% chance of a green August. Now let's look to Trend Precognition's more predictive A1 algo to see if there are more signs of how the trend will develop.
The A1 algo prints dots as long and short signals anytime the A1 slope line crosses the blue dashed center line. The A1 Slope Line indicates the direction and strength of momentum in near real time. It's currently signaling Long on the #BTC D, W and M charts.


The highest probability signals occur when there is confluence between both Trend Precognition algos so the A2+ arrows are aligned with the A1 dots and the A1 slope line continues in the direction of the signals. When the A1 slope line rolls over, indicates a loss of momentum.

We don't currently have confluence between both Trend Precognition algos, but we do have a Long signal from the A2+ with a Probability Score of 33.4% and we have a real time indication from the A1 Slope Line that despite the volatility, the upward trend still has momentum.

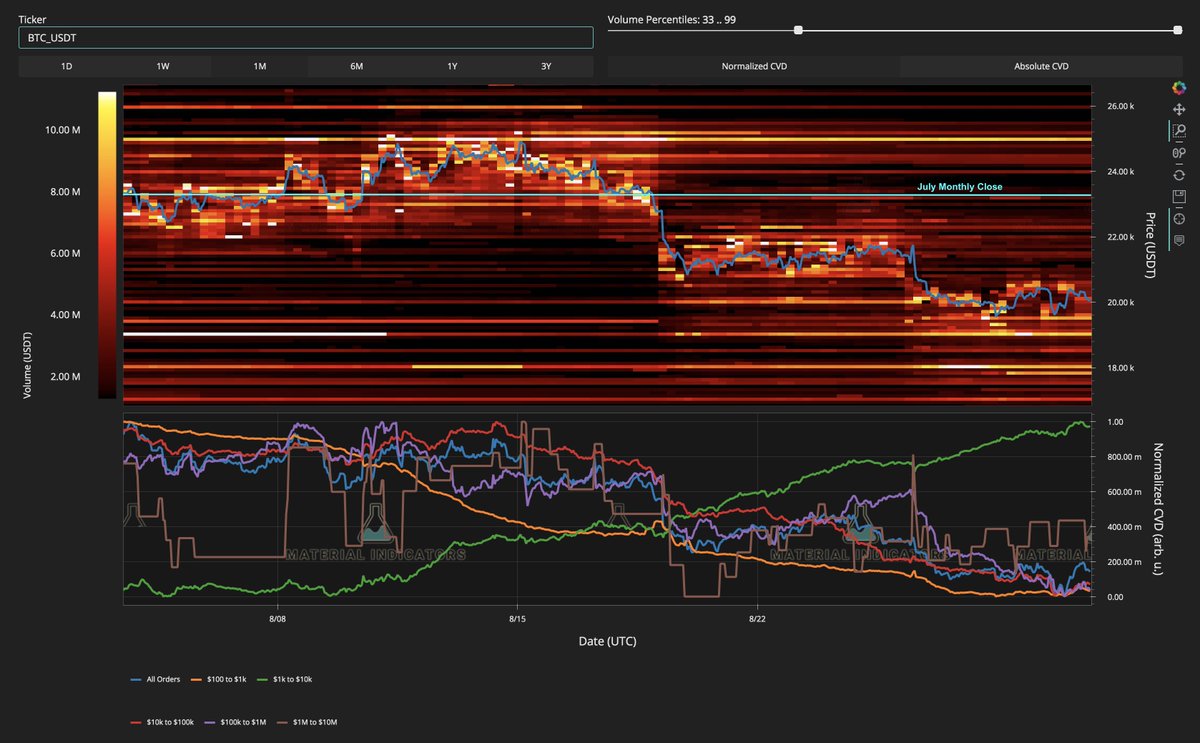
There is no crystal ball to give us the answers, but #FireCharts does provide a clear window to where liquidity sits and moves in the order book. We can see near range bid liquidity building and ask liquidity above $20.5k is thin.
Considering the reality of the global economic situation weighing heavy on all markets rn, it's hard to imagine a rally from here...unless, of course you have conviction that a rally in this environment is a Bear Market Rally or simply put, an Exit Rally.
IF:
Trend Precognition A2+ Algo is Long on the M w/ a Probability Score of 33.4%
+
The A1 Slope Line shows upward momentum on the D, W, and M charts
+
#FireCharts shows bids stacking
+
Fundamentals support the idea of an Exit Rally to retest the 200 WMA
= Increased Probability
Trend Precognition A2+ Algo is Long on the M w/ a Probability Score of 33.4%
+
The A1 Slope Line shows upward momentum on the D, W, and M charts
+
#FireCharts shows bids stacking
+
Fundamentals support the idea of an Exit Rally to retest the 200 WMA
= Increased Probability
Before you "Bro" me to death and claim that I told you #BTC was going to close August green, let me remind you, I've made no predictions. I've only shown you some data that supports a >33.4% Probability of what would be an insane move, but with < 7 hrs to close PA looks anemic
With each passing hour we get closer to the Monthly close, the probability of #Bitcoin pulling off a 15% move decreases. A retest of the 50 Month MA would be a more reasonable target, but even that is a stretch at this point. However, ...

As we commonly see with weekly and monthly candle closes / opens, if #Bitcoin bulls have a Hail Mary left in them, it typically happens in the hours or minutes surrounding the candle close / open
Considering the time, I would be surprised to see a retest of the 200 WMA before the August candle closes, however a catalyst that could trigger a rally would be another retest and bounce from $19.5k which we've been flirting with all day. Whales seem keen to buy that range.

If #BTC does rally, I'll sell the rip and print green PnL regardless of how the M candle closes.
As usual, this thread was meant to be more educational than speculative and contains no financial advice. If you found it helpful, please smash the like button, comment and share it.
As usual, this thread was meant to be more educational than speculative and contains no financial advice. If you found it helpful, please smash the like button, comment and share it.
If you want to learn more about Trend Precognition, #FireCharts or any of our institutional grade data, click the web link in the profile or visit our @YouTube channel. youtube.com/c/MaterialIndi…
• • •
Missing some Tweet in this thread? You can try to
force a refresh