Embarrassed by your #R code?
Here are 4 mistakes beginner R coders make AND how to avoid them.
#rstats #datascience
Here are 4 mistakes beginner R coders make AND how to avoid them.
#rstats #datascience

The reality is you aren't going to become a master R programmer over night.
But I see beginners making the same mistakes time and time again.
And they are easy to correct.
Here are the 4 most common mistakes and how to easily correct them.
But I see beginners making the same mistakes time and time again.
And they are easy to correct.
Here are the 4 most common mistakes and how to easily correct them.
1. Not using comments
This is a huge no-no.
Why?
Because comments help others understand your code INCLUDING future you.
This is a huge no-no.
Why?
Because comments help others understand your code INCLUDING future you.
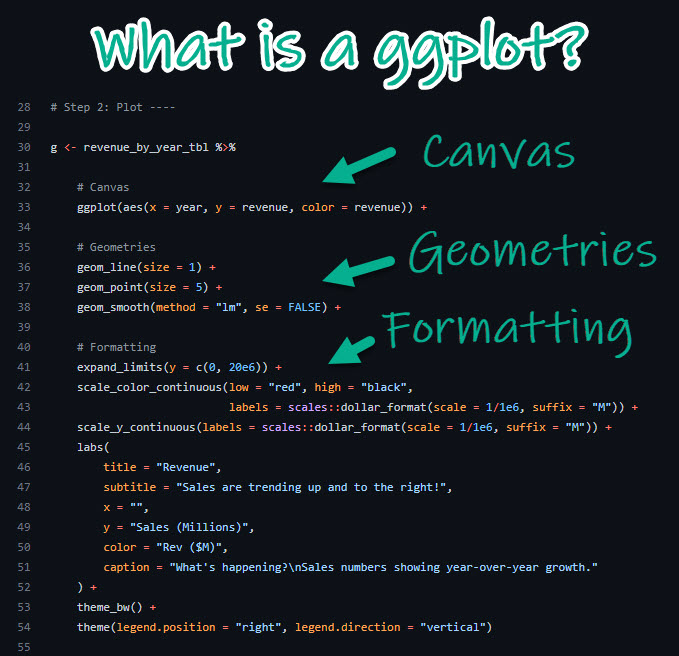
2. Not using THE PIPE
The pipe %>% is a super-handy feature of the #tidyverse that lets you chain multiple data processing steps together.
The pipe %>% is a super-handy feature of the #tidyverse that lets you chain multiple data processing steps together.
Why use the pipe?
A side-effect is that your code becomes more READIBLE.
Just like comments, it makes it easier on others AND future you.
A side-effect is that your code becomes more READIBLE.
Just like comments, it makes it easier on others AND future you.
3. Not using dplyr (aka using base R only)
Even I will admit that Base R is a mess.
So why are you using it?
Even I will admit that Base R is a mess.
So why are you using it?
Instead, use #dplyr which has readable verbs like group_by() and summarize().
dplyr verbs make it MUCH easier to understand what your code is doing.
Again, this helps others AND future you.
dplyr verbs make it MUCH easier to understand what your code is doing.
Again, this helps others AND future you.
4. Not using spacing.
R can handle white space... So use it.
Here's my simple spacing hack...
R can handle white space... So use it.
Here's my simple spacing hack...
Space out operations onto multiple lines.
Align = signs
This dramatically improves the readability of your code.
So when you do complex summarize(), you can quickly spot errors and read what you've done.
Align = signs
This dramatically improves the readability of your code.
So when you do complex summarize(), you can quickly spot errors and read what you've done.
BONUS...
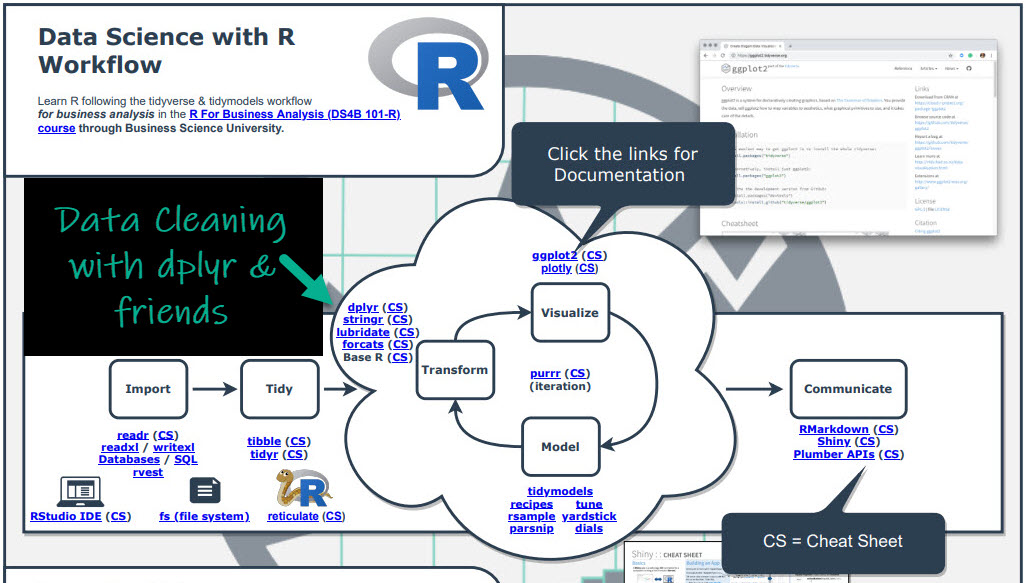
If you want to become a BETTER R programmer quickly, then I have an EXPRESS PATH CHEAT SHEET FOR LEARNING R.
What does this cheat sheet do??
If you want to become a BETTER R programmer quickly, then I have an EXPRESS PATH CHEAT SHEET FOR LEARNING R.
What does this cheat sheet do??
It consolidates the 20,000 R packages into the 100 best so when you want to work in:
- #Marketing
- #TimeSeries Analysis
- #Finance
- #Geospatial
- #MachineLearning
... Then you just learn these R packages on my cheat sheet!
- #Marketing
- #TimeSeries Analysis
- #Finance
- #Geospatial
- #MachineLearning
... Then you just learn these R packages on my cheat sheet!
And if you want more #free R-tips and coding advice, here's my latest R-Tip on exploratory data analysis (EDA).
business-science.io/code-tools/202…
business-science.io/code-tools/202…

• • •
Missing some Tweet in this thread? You can try to
force a refresh