When it applies it is typically true for all of Northern Europe for those of u who read somewhere not to worry as in the future wind power will be imported from neighbouring countries. It wonβt.
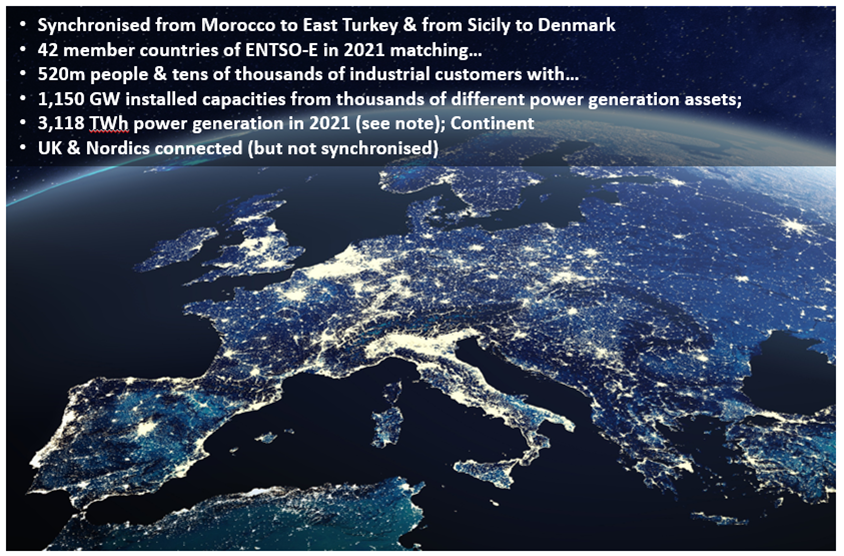
The European electricity grid is a modern miracle. It is the largest synchronous electrical grid (by connected power) in the world. It interconnects 520 million end-customers in 32 countries, including non-European Union members such as Morocco or Turkey.
- Consumption: -12.2% yoy;
- RUS pipe imports: -48% yoy (inc. RUS LNG imports -42%);
- Local Production: +0.6% (Groningen could increase EU production by 10% alone within weeks);
- LNG imports: +70%.
- Net storage build: 45bcm!
- ITA, FRA, GER, POL or CZE have done a great job saving gas to fill salt cavities et al "whatever it takes style".
- UK cannot b/c it lacks storage;
- EE struggles to access more flows;
- EU covers 51 of 180 winter days (<2 months).
The European electricity crisis is deepens as it proves hard to save gas.
1) π«π· had to reduce nuclear output further due to high river temp (u can cool the reactor, but cannot let water back into the river to protect wildlife).
Result: Nuclear output (in MWh) collapses.
1/n
As I explained in the past days, π«π· has Europe's 2nd largest grid and was an exporter for as long as we can measure it. Not anymore.
European electricity prices are spiking for all major economies except for Spain. But also Spanish consumers pay 3x more compared with only May 2021.
2/n
In fact, most European power prices are 12-15x higher than they were in 2015. Needless to say, the European industry will go into a deep recession at these prices.
Starting June 2nd, Cu collapsed 29% in less than six weeks. How often did that happen?
Answer: not often! In past 25y Cu crashed only 8x >7% in a single week as in one week this June (stat below) & only 29x >5% (2x per week in June & July 2022).
Big quantamentel signals!
2/n
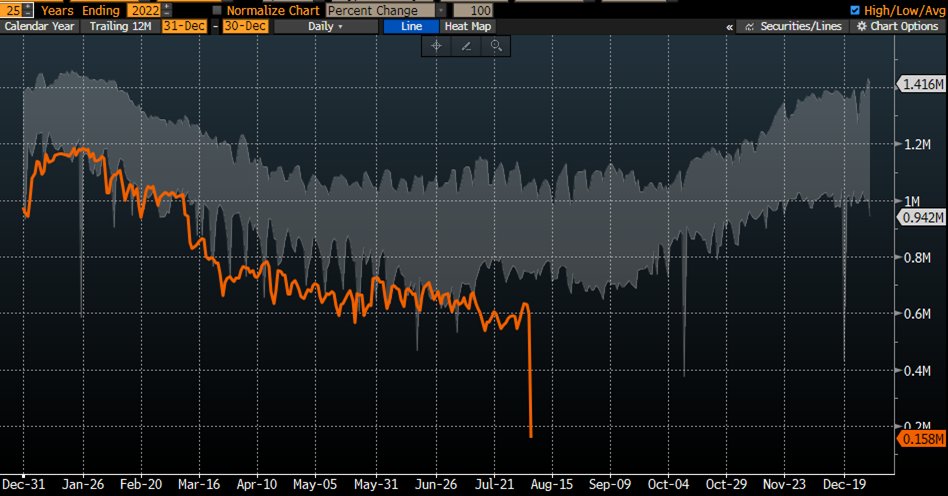
How is that possible, when global reported inventories (LME; Comex; Shanghai) are below their 10-year average? Aren't commodities priced on inventories?
Chart: Global Cu inventory (reported by exchanges); Source: Bloomberg 3/n