
A late night 🧵 on some tips for making grayscale (BW) & colorblind (cblind) friendly graphs in @Stata. BW in case people print out papers, and cblind to make sure documents are "barrier free".
Graphs have 3 elements that we can control: colors, line patterns, & symbols.
1/
Graphs have 3 elements that we can control: colors, line patterns, & symbols.
1/
https://twitter.com/RaisaRubio/status/1581146673882898432
Let's start with colors: Whatever color scheme we use, we can check whether it will pass the BW and cblind tests. This can be easily tested using the palettes package. Install these, if you haven't already:
ssc install palettes, replace
ssc install colrspace, replace
2/
ssc install palettes, replace
ssc install colrspace, replace
2/
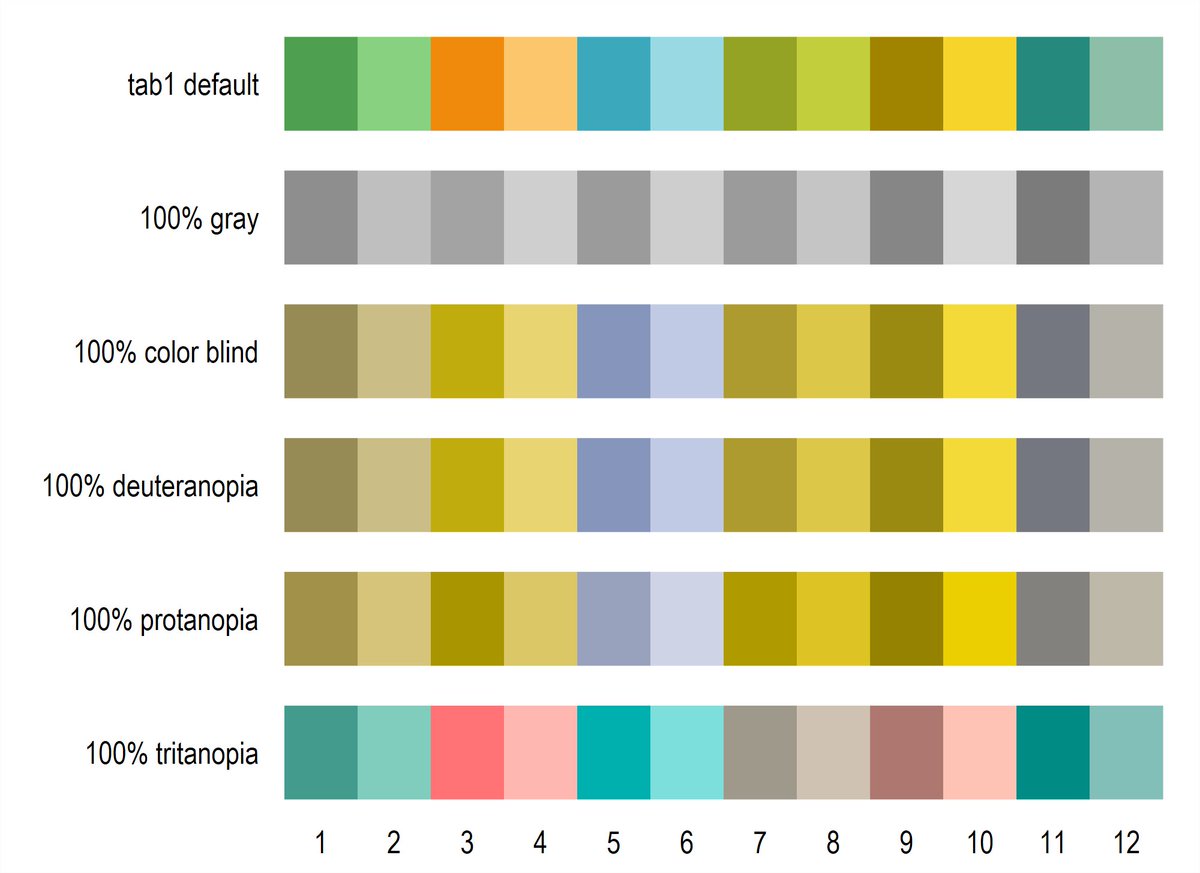
There are three types of common color-blindnesses that can we can check in #Stata: "Protanopia" & "Deuteranopia" where shades of red and green are not discernable, & "Tritanopia" where blue-green, purple-red, yellow-pink are hard to differentiate.
Test yourself 👇👇
3/
Test yourself 👇👇
3/

The extreme case is where one has both red-green & blue-yellow colorblindness.
Let's take the default s2 colors & see if it passes the test: The BW part has gray shades spaced out for the first 5 colors but spacing is not even. Same for cblind.
4/
Let's take the default s2 colors & see if it passes the test: The BW part has gray shades spaced out for the first 5 colors but spacing is not even. Same for cblind.
4/


There are several well thought-out color palettes readily available. For example, I use "tableau" a lot. Let, see how it does using the same code as above but just replacing s2 with tableau:
It sort of also works for grayscale and some of the cblind options but not all.
5/
It sort of also works for grayscale and some of the cblind options but not all.
5/

Let's try 2 purpose built schemes: These are "okabe" and "viridis". Okabe is for discrete variables. You can see that it passes the cblind test very well but not the B&W one. But look at Viridis. You can see immediately what makes it so popular. It passes all the tests 🤩!
6/
6/


Below r the results of the 4 cblind schemes I have released as part of the schemepack (github.com/asjadnaqvi/Sta…)
tab1, tab2, tab3, cblind1
They all work well for colorblindness, maybe not for all BW shades. Here we can add additional elements for more control.
7/
tab1, tab2, tab3, cblind1
They all work well for colorblindness, maybe not for all BW shades. Here we can add additional elements for more control.
7/


These are markers and lines. By default I do not build these inside my own schemes. They are controlled at a second stage. Let's see how:
Load the schemepack, data, and do a basic plot. Tableau colors are great for colored images but maybe they do not work well in BW.
8/
Load the schemepack, data, and do a basic plot. Tableau colors are great for colored images but maybe they do not work well in BW.
8/


Let's pass a cblind friendly color scheme. Here Okabe gives us higher contrast in colors.
We can also select any other cblind scheme from the "colorpalettes" package and pass it.
For more info, check this guide:
medium.com/the-stata-guid…
9/
We can also select any other cblind scheme from the "colorpalettes" package and pass it.
For more info, check this guide:
medium.com/the-stata-guid…
9/


We can also pass on custom line patterns using "linepalette" (also part of the palettes suite), where we can access sets of different patterns.
The command also allows us to pick the patterns we want using the "select" option. See its help file.
10/
The command also allows us to pick the patterns we want using the "select" option. See its help file.
10/


Lastly, we can also customize the markers using the "symbolpalette". We can also pick & choose sets & select markers within them.
We can also combine all of the above 3 elements. Just need some pratice with storing & passing around locals. But this should be case-dependant!
11/
We can also combine all of the above 3 elements. Just need some pratice with storing & passing around locals. But this should be case-dependant!
11/


To summarize: colors, line patterns, & markers can be easily modified in #Stata to create BW & cblind friendly graphs. It might seem a lot of work, but one can generate a template of colors & patterns and save these, either in custom scheme files, or just as scripts.
12/
12/
I have a guide on generating scheme files here:
medium.com/the-stata-guid…
You can also use "grstyle" or "brewscheme" packages, or generate .style files (advanced application!) to create customized graphs on the fly.
Make this one-time investment and up your graph game!
/END
medium.com/the-stata-guid…
You can also use "grstyle" or "brewscheme" packages, or generate .style files (advanced application!) to create customized graphs on the fly.
Make this one-time investment and up your graph game!
/END
• • •
Missing some Tweet in this thread? You can try to
force a refresh


