QF Research Profile picture
Oct 18 6 tweets 3 min read
1) SF Fed paper "finds national homeowners’ shelter prices rose 4.3% Y/Y in July 2022, compared with 5.8% in the CPI measure" based on actual payments.

- OER based on the “implied rent” that owners indirectly pay to ...

$SPY $NDX $TLT $GLD #Commodities
frbsf.org/economic-resea…
2) live in their homes. Implied rent cannot be observed, so the CPI uses an estimate (i.e. very imperfect, lagged and difficult to model as I've discussed).

Magnitude of shelter #CPI has surprised most, including Nobel laureates, Harvard professors, GS economists (who today ...
3) adjusted their model and increased '23 shelter inflation estimate).

Here are a few threads/debates:


Then an empirical data set with what's actually being paid for shelter is ...
nytimes.com/2022/10/14/opi…
4) lower than CPI?

As author states "an advantage of this method is that the payments measure uses actual homeowner costs, rather than estimated implicit rent. This sidesteps issues that could arise in the CPI’s rent-based measure resulting from differing shelter price ...
5) dynamics for renter- and owner-occupied units and from the lag caused by the tendency for rents to change only annually. While the CPI is available for only 23 metro areas, the payments measure covers nearly all counties and metro areas. This is an advantage because, as a ...
6) non-traded service, shelter prices show more geographic variation than prices in other CPI categories.

• • •

Missing some Tweet in this thread? You can try to force a refresh
 

Keep Current with QF Research

QF Research Profile picture

Stay in touch and get notified when new unrolls are available from this author!

Read all threads

This Thread may be Removed Anytime!

PDF

Twitter may remove this content at anytime! Save it as PDF for later use!

Try unrolling a thread yourself!

how to unroll video
  1. Follow @ThreadReaderApp to mention us!

  2. From a Twitter thread mention us with a keyword "unroll"
@threadreaderapp unroll

Practice here first or read more on our help page!

More from @ResearchQf

Oct 18
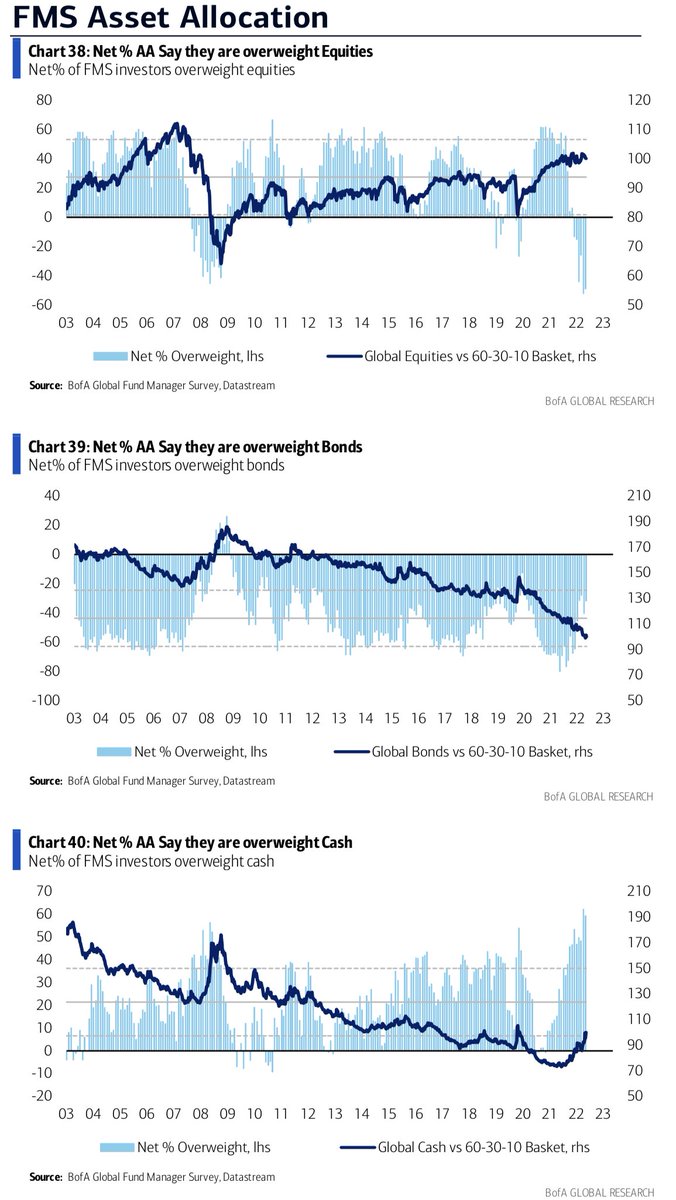
1) BofA Oct Global Fund Manager Survey released today.

Most charts are saying similar things and are at/near '08 extremes. But here's a sample.

Net fund managers % saying overweight cash and underweight equities beyond peak '08 levels.

$SPY $NDX $TLT $GLD #Commodities Image
2) Close to record levels of investors expect a weaker economy next 12M.

#Inflation expectations at Dec '08 level. Image
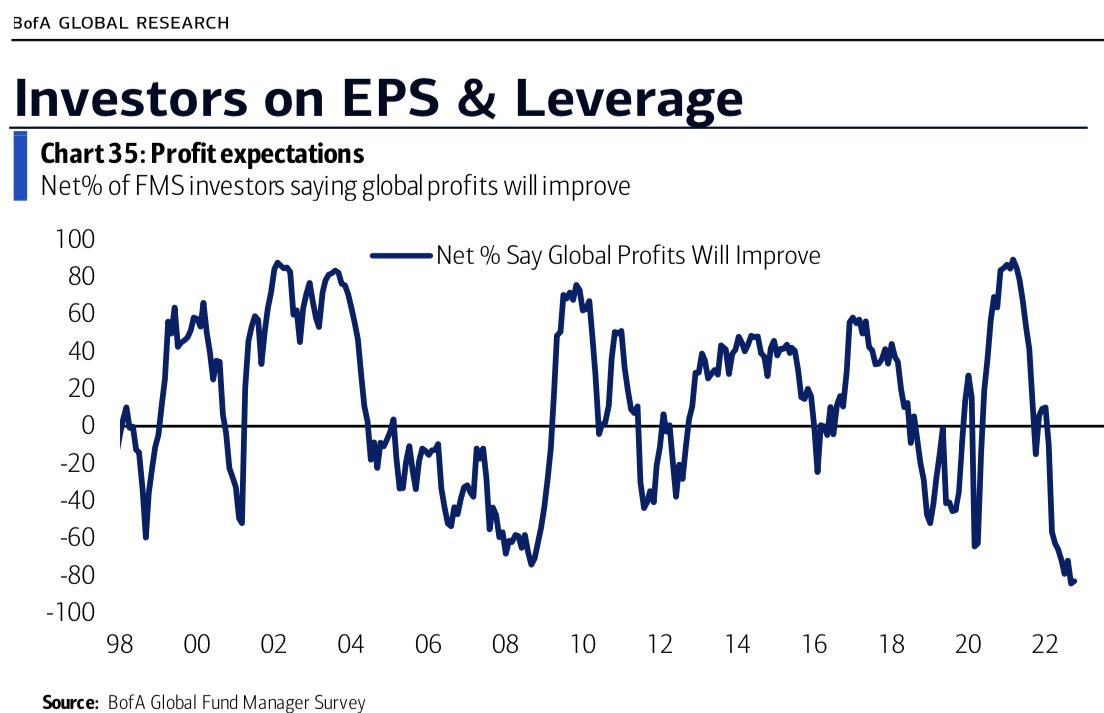
3) Lowest % on record saying taking higher than normal risk.

Lowest % saying global profits will improve. ImageImage
Read 5 tweets
Oct 17
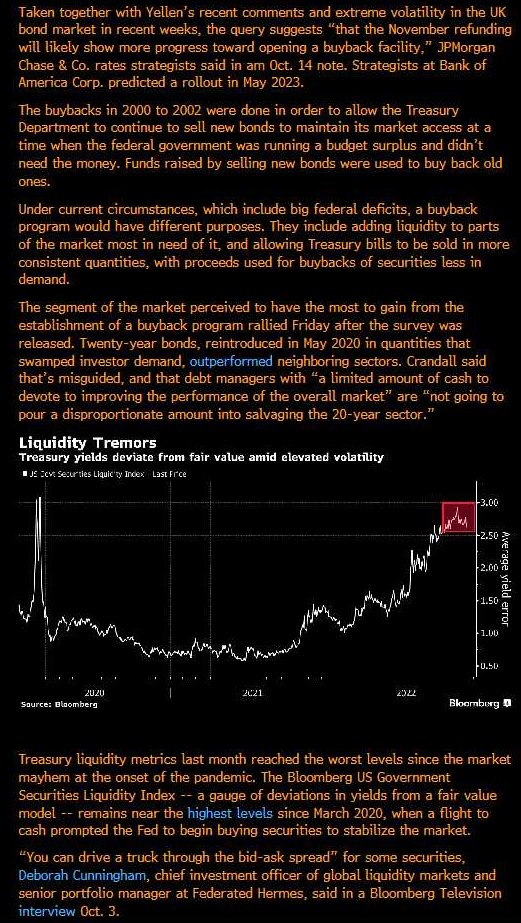
1) Bberg implies selling bills to buy back bonds, so has elements of Operation Twist.

"allowing Treasury bills to be sold in more consistent quantities, with proceeds used for buybacks of securities less in demand."

This would also help ...

$SPY $NDX $TLT $GLD #Commodities
2) release RRP liquidity.

But haven't seen any evidence that this is their intention (sell bills to buy back off-the-run-Treasuries). If Treasury matches tenor by selling on-the-run-Treasuries instead, liquidity of older bonds will improve but market impact is quite different.
3) If anyone has any insights here, would love to hear from you.
Read 4 tweets
Jul 23
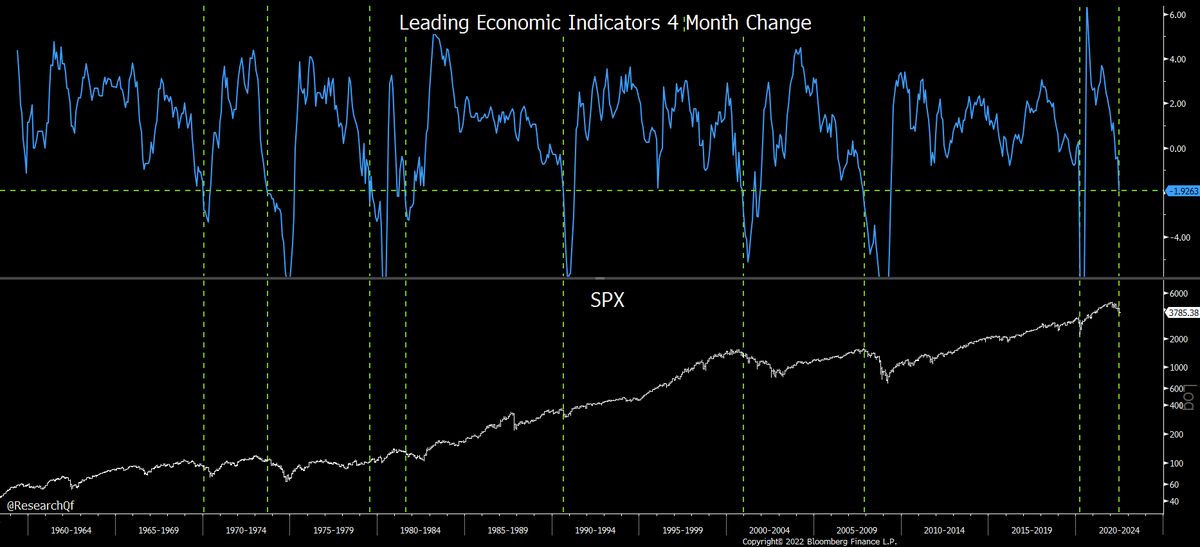
1) Another view of 4M decline in LEI.

Not 4M in a row but % change in 4M. Perhaps -0.6%, -0.8%, +0.1%, -1.2% is worse than -0.2%, -0.3%, -0.1%, -0.4%?

All priors when 4M change was as low led to a #recession within a ...

$SPY $QQQ $TLT $GLD #Commodities
2) few Q's (or already in recession in some cases) since the '60's.

Interestingly, this approach dramatically shortened lead time to '08 recession vs LEI down 4M in a row. Signal kicked in Nov '07 instead Jul '06.

Apply your interpretations.

Jobless claims 4W MA rose 70K ...
3) last week.

Again, this did precede every recession since '68.

OTOH 2 of 10 priors ('84 and '96) didn't result in recessions.

However, if initial jobless claims approach anything near 300K, the patterns will be significantly different from the 2 ...
Read 7 tweets
Jul 10
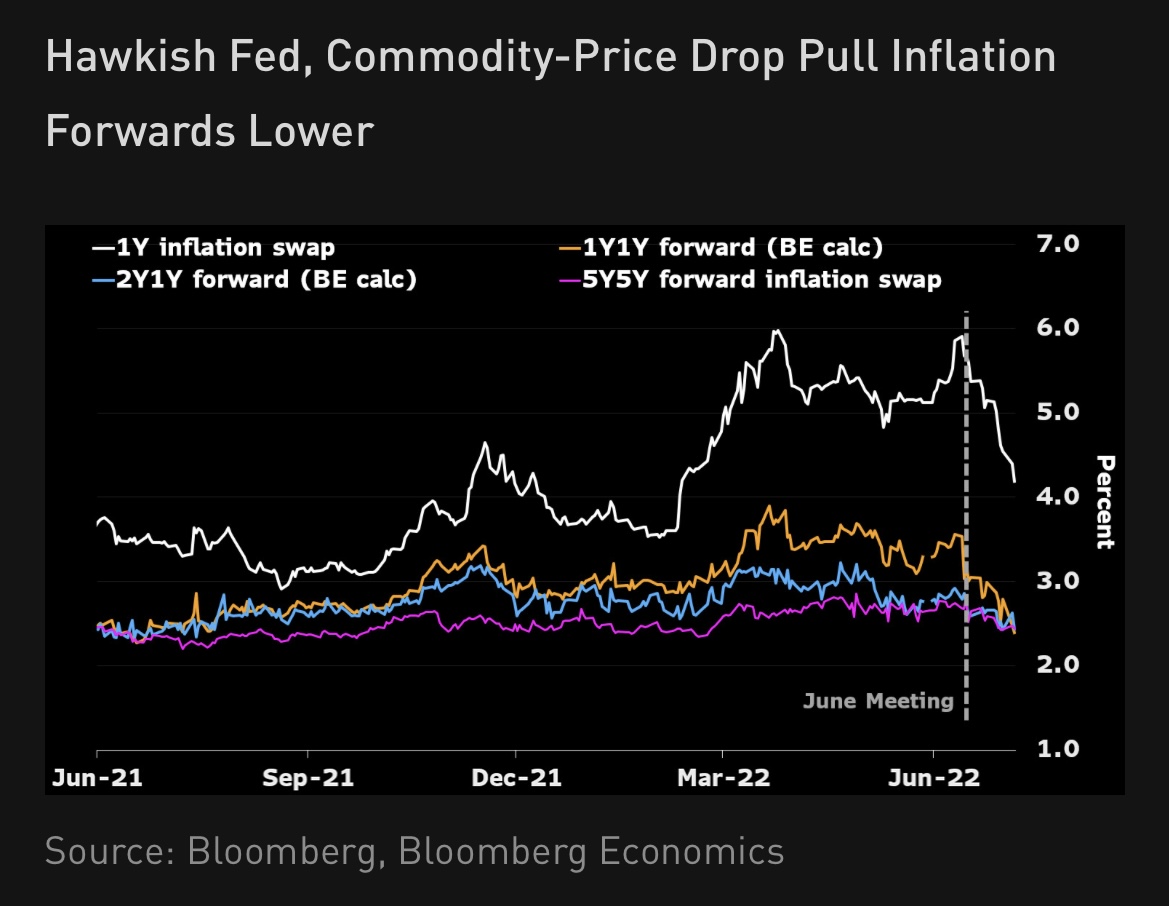
1) 1Y breakeven (1Y forward) < 2.5%, a 52W low and below when #inflation was transitory in ‘21.

1Y breakeven (current) 3.8% vs 6.3% in Mar. When Jun/Jul 8-9% CPI rolls off and sub 3% #’s roll in, 1Y inflation expectations will be 2’s % by Aug!

$SPY $QQQ $TLT $GLD #Commodities Image
2) Will change with data but consistent with current inflation swaps pricing early ‘23 as discussed.

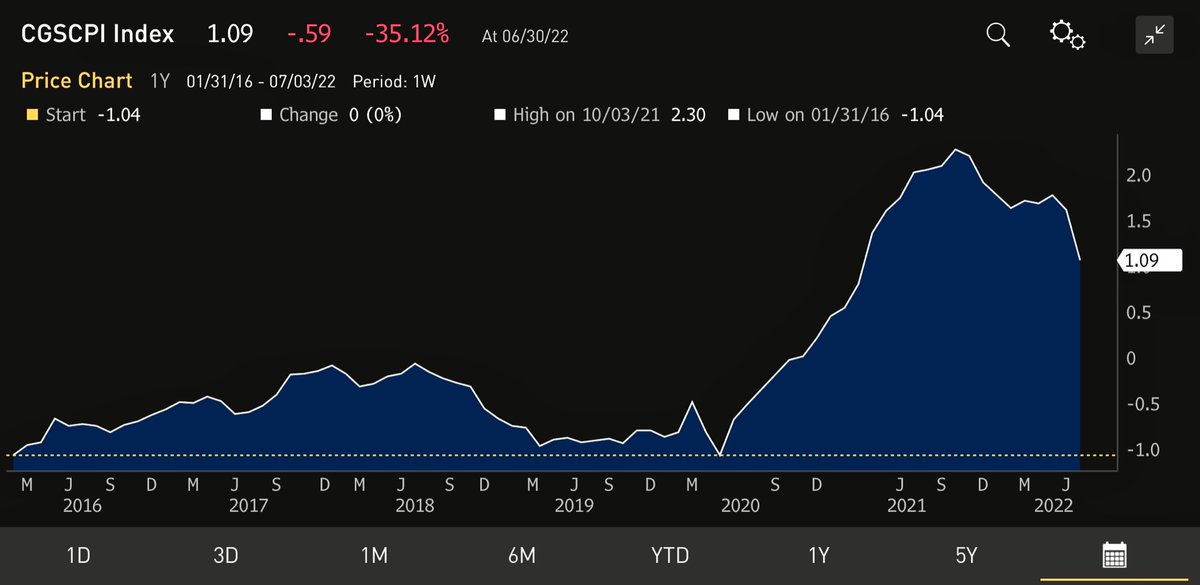
Also Citi’s Global Supply Chain Pressure Index fell by largest amount in its history in Jun.

Prefer this to NY Fed Supply Chain Pressure Index. Citi includes inventory data … Image
3) in addition to many transport cost and supply components (e.g. delivery times, backlogs, input prices etc). I’ve discussed variety of metrics used in these indices in past posts.

Implied gas still low $4’s. Still unreal how bad Fed’s timing has been.
Read 6 tweets
Jul 2
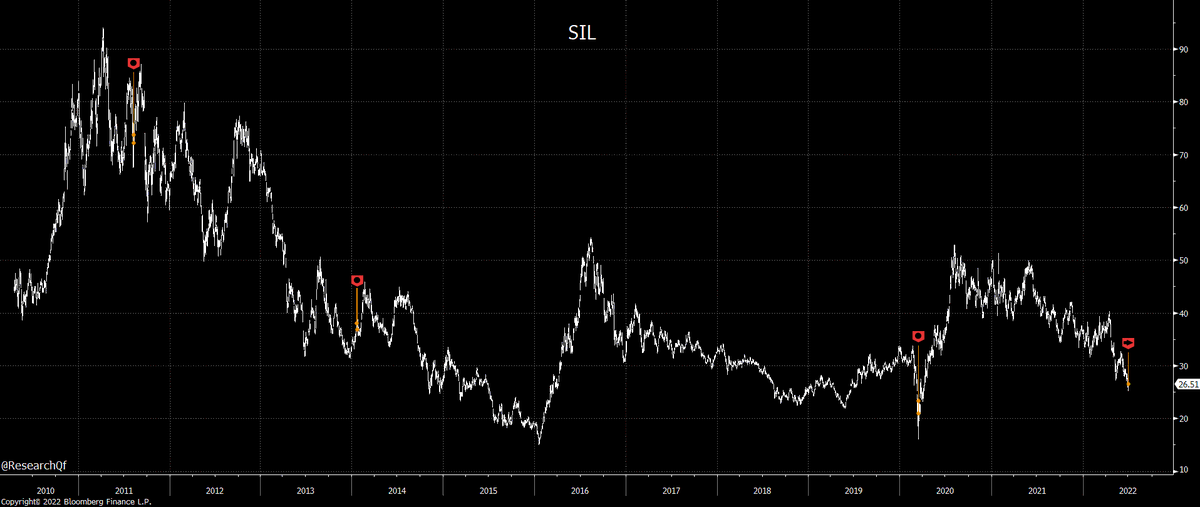
1) $GLD down a bit but $GDX $GDXJ strong Fri.

Many backtests with various conditions/timeframes improves at least ST risk/reward (i.e. not guarantee).

Even in May there was a ST rally.

And $SLV < -1.5% but $SIL > +2%?

$SPY $QQQ $TLT #Gold #Commodities
2) Also looks bullish tho N=only 3 since ‘10.

Given how oversold/multiple indicators showing signs of capitulation, prob better to have these than not.

As @TheDailyGold mentioned, % of $HUI stocks above 200D MAs was 0% Thur.

Besides ‘13 very low % …
thedailygold.com/gold-stocks-ar…
3) of HUI components above 200D MAs was IT/LT bullish.

Posted these Mar ‘21 and Sep ‘21 when % was < 5.

And only other day at 0% last 5Y was 3/13/20.

Didn’t expect new 52W lows in HUI given pinned post.

There was a big bounce after 3/16/22. But max …
Read 5 tweets
Jul 1
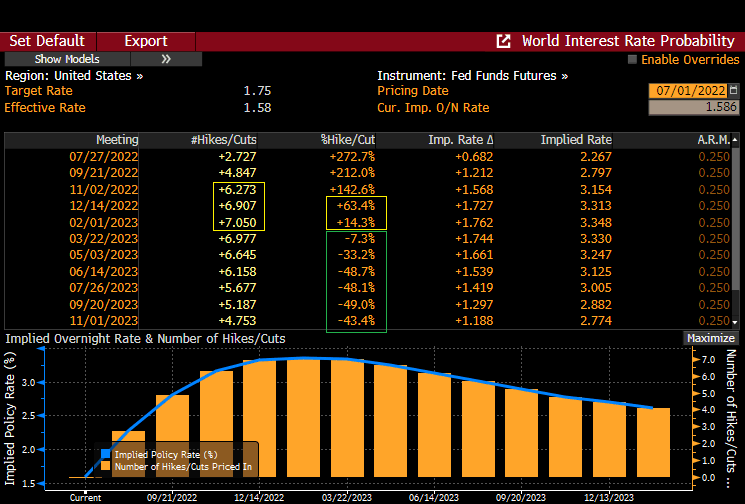
1) #Fed funds futures update.

Pricing only 0.78 hikes over 2 meetings (Dec '22/Feb '23). So basically 100% chance of Dec or Feb pause and ~20% chance of 0 hikes after Nov.

Implied Dec rate 3.31% vs 3.78% peak few W ago.

$SPY $QQQ $TLT $GLD #Commodities
2) Notice small prob of a cut in Mar and significant prob of cuts every meeting thereafter?

What happens if ISM < 50 within few M (fed hasn't hiked with ISM < 50 since 70's)?

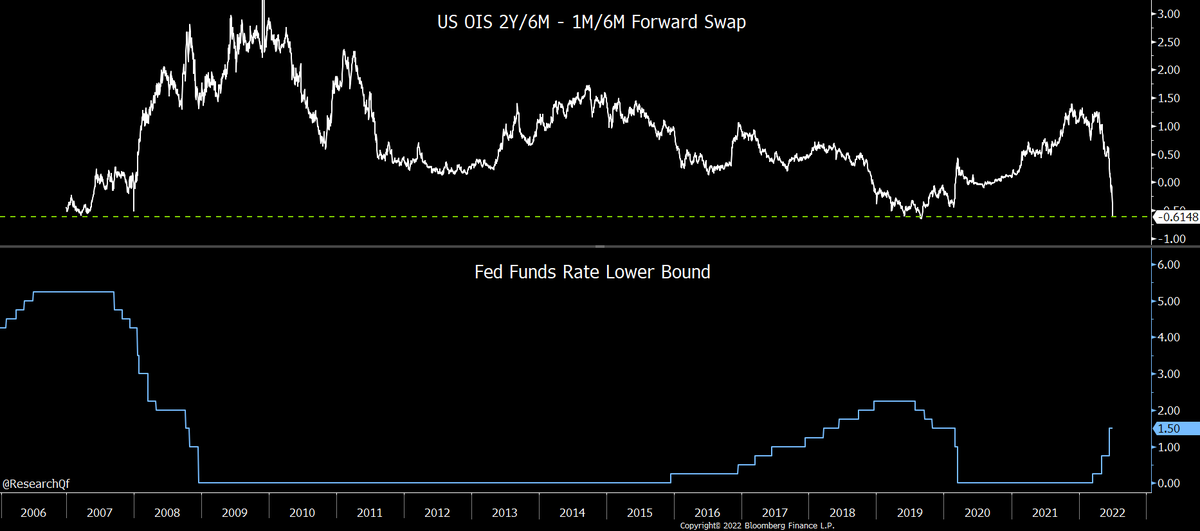
OIS 2Y-1M #yield spread 6M forward (1M is decent proxy for overnight rate) ...
3) inverted 61 bps. Using OIS swaps which are more accurate vs Treasuries (Btw how was 1M Treasury yielding 60 bp less than overnight rate last W? You get the idea).

Give this thought. Market is pricing 2Y yield ~60 bps LOWER than Fed funds rate 6M from now!

Fed paused when ...
Read 5 tweets

Did Thread Reader help you today?

Support us! We are indie developers!


This site is made by just two indie developers on a laptop doing marketing, support and development! Read more about the story.

Become a Premium Member ($3/month or $30/year) and get exclusive features!

Become Premium

Don't want to be a Premium member but still want to support us?

Make a small donation by buying us coffee ($5) or help with server cost ($10)

Donate via Paypal

Or Donate anonymously using crypto!

Ethereum

0xfe58350B80634f60Fa6Dc149a72b4DFbc17D341E copy

Bitcoin

3ATGMxNzCUFzxpMCHL5sWSt4DVtS8UqXpi copy

Thank you for your support!

Follow Us on Twitter!

:(