PART 2 of 2 - Bond crash implications for stocks:
Why does the #bonds crash signal further pressure for #stocks?
(& why do rate hikes take so long to show in earnings?)
Here I deal with general corporates, consumer & the banks:
$SPY $QQQ #macro
Why does the #bonds crash signal further pressure for #stocks?
(& why do rate hikes take so long to show in earnings?)
Here I deal with general corporates, consumer & the banks:
$SPY $QQQ #macro
CORPORATES:
As cost of capital rises, the direct impact on corporate earnings starts small then builds. The direct impact of higher rates on corporate borrowings can be estimated to be only approx -2-3% on EPS extra each year due to termed out debt at past low rates. But
As cost of capital rises, the direct impact on corporate earnings starts small then builds. The direct impact of higher rates on corporate borrowings can be estimated to be only approx -2-3% on EPS extra each year due to termed out debt at past low rates. But
about 20% of debt gets refi’d each yr so this builds to a more material headwind over 12-24 mths.
WORKING CAPITAL EFFECTS
Working capital terms start to get tightened by companies as rates rise. Due to WC debt costs (mainly floating rates), companies are forced to offer
WORKING CAPITAL EFFECTS
Working capital terms start to get tightened by companies as rates rise. Due to WC debt costs (mainly floating rates), companies are forced to offer
reduced rebates/discounts & require faster payment.
With competition, this is phased in over 12 or so months to avoid losing customers. But it results in working capital drawdowns building that reduces corporate cash.
See chart of deposits at banks falling now:
With competition, this is phased in over 12 or so months to avoid losing customers. But it results in working capital drawdowns building that reduces corporate cash.
See chart of deposits at banks falling now:

Smaller businesses are impacted the most as they have less bargaining power.
As this hits their WC balance, their cash declines, its more difficult to sell products / services & they cant fund growth, so they slow hiring, do layoffs & cut discretionary spending such as
As this hits their WC balance, their cash declines, its more difficult to sell products / services & they cant fund growth, so they slow hiring, do layoffs & cut discretionary spending such as
entertainment, consultants, travel etc which then hits those downstream service industries as well after about 12 mths.
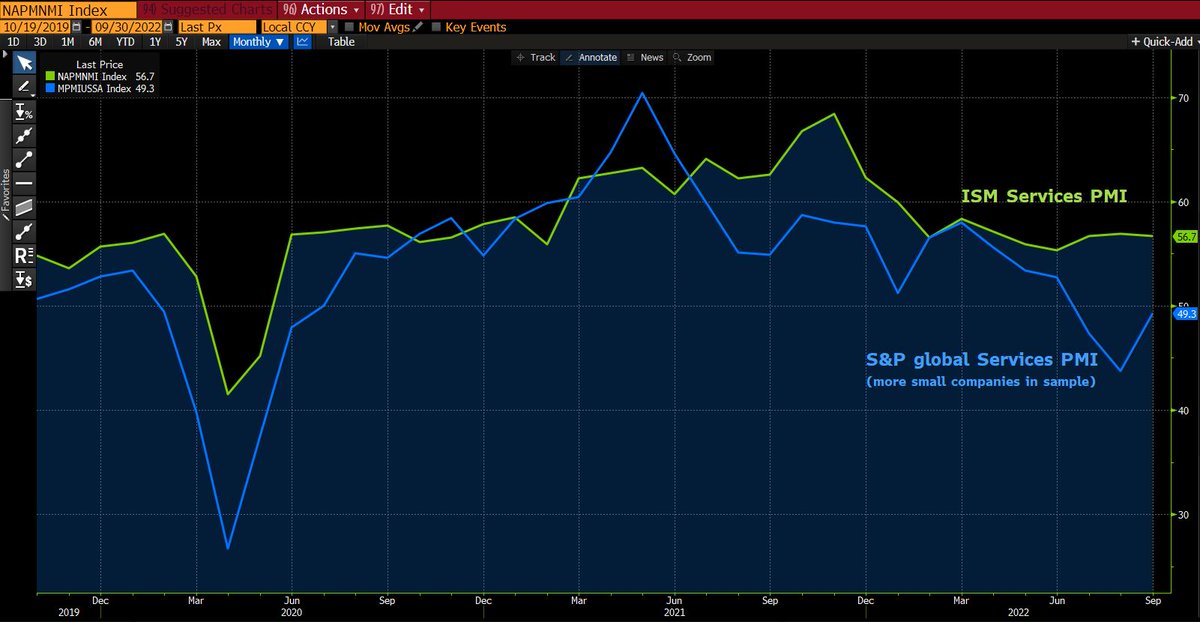
You can see this differential impact on small companies in the more rapid fall of the S&P Gobal PMI (more small co’s in sample) vs ISM (large company biased)
You can see this differential impact on small companies in the more rapid fall of the S&P Gobal PMI (more small co’s in sample) vs ISM (large company biased)
CAPEX:
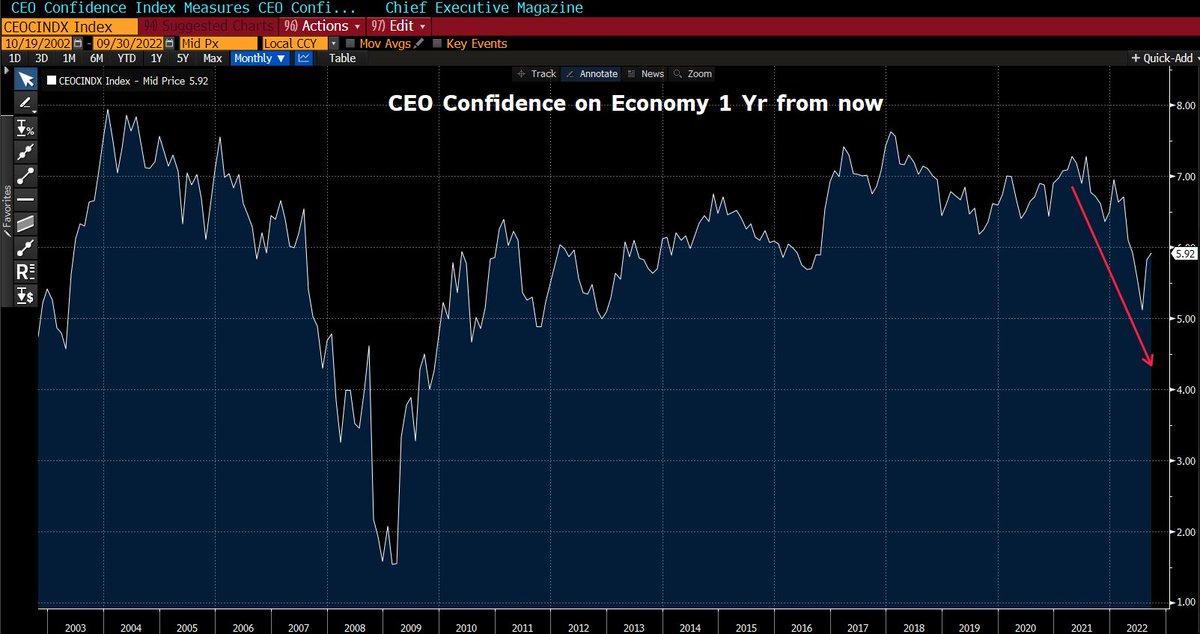
As corporates perceive weaker future demand (see CEO confidence chart) they start to reduce growth projects which means capex falls. Non committed capex projects are typically deferred fairly quickly & so companies that sell capital equipment are also earlier in the EPS
As corporates perceive weaker future demand (see CEO confidence chart) they start to reduce growth projects which means capex falls. Non committed capex projects are typically deferred fairly quickly & so companies that sell capital equipment are also earlier in the EPS
cut cycle.
But committed projects are typically completed, so this spreads the earnings impact on capex industries out to an extent as well.
Like building, the first sign is order cuts, but backlogs mean EPS impacts are delayed up to 12 months.
But committed projects are typically completed, so this spreads the earnings impact on capex industries out to an extent as well.
Like building, the first sign is order cuts, but backlogs mean EPS impacts are delayed up to 12 months.
CONSUMER:
Direct impacts of higher rates on consumers are also at first small then accumulate. That’s why BofA CEO is still remarking on resilient spend patterns.
Higher rates affect all credit card interest burdens but mortgage interest only for variable rate borrowers.
Direct impacts of higher rates on consumers are also at first small then accumulate. That’s why BofA CEO is still remarking on resilient spend patterns.
Higher rates affect all credit card interest burdens but mortgage interest only for variable rate borrowers.
But after a period of record savings, consumers have a buffer to work through for a period.
With CC’s, rates were already high & have increased but the relativity of the increase vs mortgages is low (15% to 19% for CC vs 2.8% to 6.8% for mortgages)
With CC’s, rates were already high & have increased but the relativity of the increase vs mortgages is low (15% to 19% for CC vs 2.8% to 6.8% for mortgages)
See again the chart of All deposits at Commercial banks. It increased dramatically over COVID resulting in estimated $3tr of excess savings above LT trend. But see its also declining now as higher prices (CPI) and interest just start to pac-man savings.
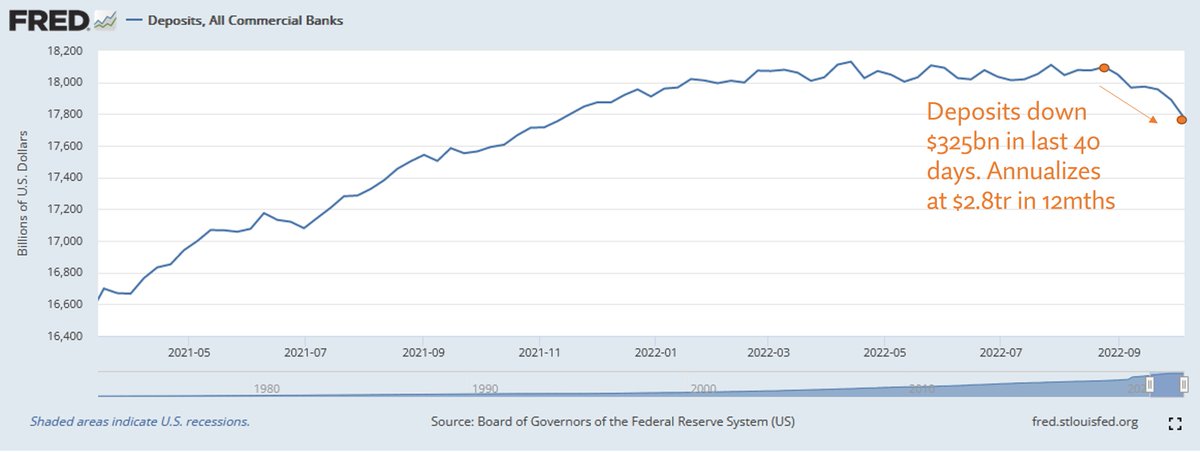
The reduction in the last 40 days in deposits at commercial banks of $325bn, annualized over 12 mths sees this entire excess savings wiped out, but it takes that amt of time.
This is both Corps & consumers. But as your cash falls, so does your spend impacting revenues across
This is both Corps & consumers. But as your cash falls, so does your spend impacting revenues across
all sectors.
The demand impact will be seen however before 12 months is out, as once your savings halves, your spend behavior is certainly impacted, irrespective of whether you still have more cash that pre COVID.
I do recognize that some of this cash draw is movement of low
The demand impact will be seen however before 12 months is out, as once your savings halves, your spend behavior is certainly impacted, irrespective of whether you still have more cash that pre COVID.
I do recognize that some of this cash draw is movement of low
interest earning deposits out of bank accounts to higher yielding T-bills now as well.
The largest impact on the consumer, is when employment uncertainty hits discretionary spend. And that lags until unemployment starts to increase.
Unemployment starts in a small number of
The largest impact on the consumer, is when employment uncertainty hits discretionary spend. And that lags until unemployment starts to increase.
Unemployment starts in a small number of
industries that as profiled previously are more sensitive to rates. We typically see that start about 12 mths from first hikes. Then as it builds into a sufficiently material amount of the labor force, the associated reduction in consumption due to lower income, itself causes
other industries to do layoffs & the effect can snowball.
BANKS:
I've left the banks to last because in a typical (non credit shock downturn - i.e. not 2008), Bank EPS pressure is a complicated mix of the positive impetus of rising net interest margins as rates rise, followed
BANKS:
I've left the banks to last because in a typical (non credit shock downturn - i.e. not 2008), Bank EPS pressure is a complicated mix of the positive impetus of rising net interest margins as rates rise, followed
by the negative force of rising delinquencies and bad debts once we reach the unemployment part of the cycle.
Banks smooth earnings by increasing provisioning when they perceive tougher times ahead as they are doing now, but eventually in a rising inflation / slowing growth
Banks smooth earnings by increasing provisioning when they perceive tougher times ahead as they are doing now, but eventually in a rising inflation / slowing growth
economy, and as rates cease rising, the pressure hits them too with credit growth & NIM tailwinds ceasing, rising operating costs & rising bad debts/provisions reducing EPS. Banks are highly leveraged, so bank EPS cuts at this juncture can appear swiftly and be large in magnitude
In conclusion:
We're 9mths now into this hike cycle but much of that has occurred in the last few mths. As this thread describes, the pressure on company EPS builds from here gradually then swiftly. My analysis below shows the EPS impact building thru '23
We're 9mths now into this hike cycle but much of that has occurred in the last few mths. As this thread describes, the pressure on company EPS builds from here gradually then swiftly. My analysis below shows the EPS impact building thru '23
https://twitter.com/andycwest/status/1579412403628171269?s=20&t=uMp5Oqvfpa5i07koVlPRQg
to a material level.
With protracted EPS declines likely you wouldn’t expect to see P/E expansion offset that.
Consequently, the 2nd phase, is likely further falls in stock prices due to earnings
The Bond crash is just a front-loaded reflection of the impact that’s on the way
With protracted EPS declines likely you wouldn’t expect to see P/E expansion offset that.
Consequently, the 2nd phase, is likely further falls in stock prices due to earnings
The Bond crash is just a front-loaded reflection of the impact that’s on the way
If you missed Part 1 of this thread, you can access it here:
https://twitter.com/andycwest/status/1582598263949361152?s=20&t=ox-D7y-jkoRhaVzQ9sl9-Q
• • •
Missing some Tweet in this thread? You can try to
force a refresh