Updated Inflation, rates outlook & prospects for #bonds and #stocks:
We're moving into a new phase of disinflation from here. This is what I expect to see unfold: Update 🧵:
#macro $SPY $QQQ #inflation
We're moving into a new phase of disinflation from here. This is what I expect to see unfold: Update 🧵:
#macro $SPY $QQQ #inflation
Back in early August I wrote that we were about to experience a surge in core inflation into end Q3.
At the time #stocks had rallied strongly and this presaged another pullback given it meant the #Fed had to be more hawkish.
I was a touch early w/ mths:
At the time #stocks had rallied strongly and this presaged another pullback given it meant the #Fed had to be more hawkish.
I was a touch early w/ mths:
https://twitter.com/andycwest/status/1557110837059325952?s=20&t=3Ezw1vdqQ1s372hDh4O60A
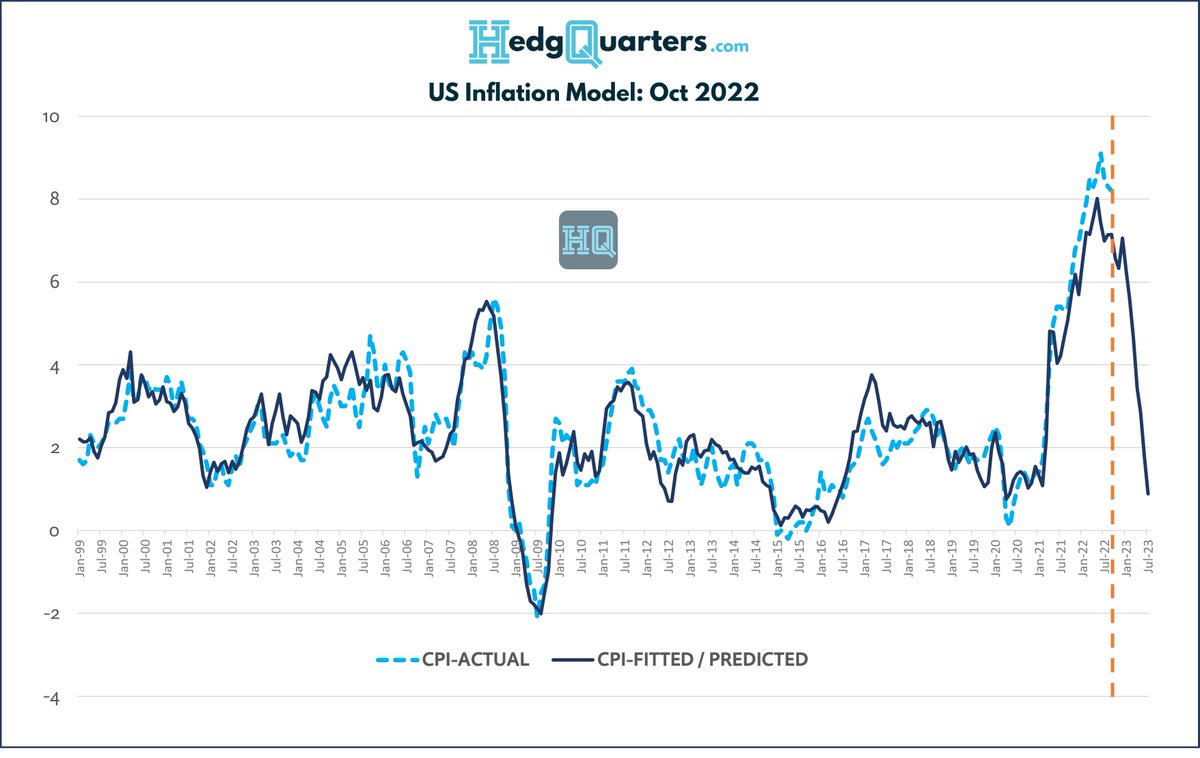
This played out and I've posted my multi-factor inflation model for US CPI previously. It shows #inflation moderating quickly in mid 2023:
Fair to say this generates skepticism. The narrative is once CPI >5% it stays there for > 2 years. Well where to now?
Fair to say this generates skepticism. The narrative is once CPI >5% it stays there for > 2 years. Well where to now?

The simplest way to forecast CPI near term is to take last mths CPI, deduct the MoM reading thats cycling out & add your nowcast for the mth coming in.
In Oct22, this meant 8.2% - 0.9% + 0.4% = 7.7% (exactly where it landed).
So whats cycling out over next few months?
In Oct22, this meant 8.2% - 0.9% + 0.4% = 7.7% (exactly where it landed).
So whats cycling out over next few months?
The average MoM CPI cycling out in the next 8 mths from the calc is 0.81%, while the current run rate MoM is ~0.4%.
That means we are CLEARLY in the disinflation phase baring a renewed oil spike.
Critically: There WILL be v large step downs in #CPI in Mar, May and Jun 2023...
That means we are CLEARLY in the disinflation phase baring a renewed oil spike.
Critically: There WILL be v large step downs in #CPI in Mar, May and Jun 2023...
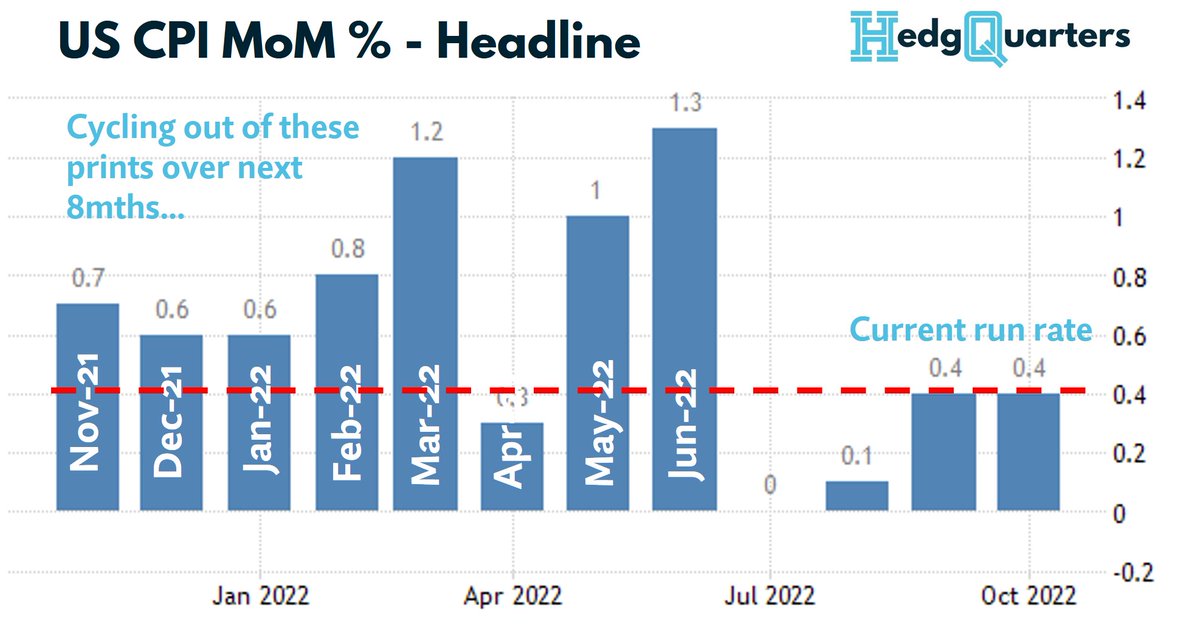
MoM CPI readings can show chop given sampling issues so hard to know whether Nov 22 will be 0.4% or 0.6% but its cycling out a 0.7%, so once again base case is flat to small decline in headline CPI when it arrives.
Keeps building the case for rate hikes tailing off
My CPI...
Keeps building the case for rate hikes tailing off
My CPI...
model, called for #CPI to end the year around 7.5% which looks pretty good so far.
But as the mthly chart shows, CPI is likely to keep dropping with a number of large step downs.
This brings us to the IMPLICATIONS:
But as the mthly chart shows, CPI is likely to keep dropping with a number of large step downs.
This brings us to the IMPLICATIONS:
The DISINFLATION phase is different for #bonds, #stocks & earnings to the INFLATION we have just been going through.
1st #bonds: they havent worked as an asset class in '22 due to CPI pushing up terminal rate expectations. This drags up longer bond yields as well so bonds fall
1st #bonds: they havent worked as an asset class in '22 due to CPI pushing up terminal rate expectations. This drags up longer bond yields as well so bonds fall
We should expect that terminal rate expectations stabilize as lower CPI comes in.
This removes the upward drag from long bond yields, and as growth slows, they can fall with #bonds starting to perform again over the next 12 mths.
Stocks?
This removes the upward drag from long bond yields, and as growth slows, they can fall with #bonds starting to perform again over the next 12 mths.
Stocks?
#Stocks a may be having a year end rally but its likely unsustainable. Earnings are a nominal flow. That is they are boosted by #inflation. As disinflation sets in, during a falling growth period, earnings lose 2 cushions & sag badly.
Expect accelerating EPS cuts in '23
Expect accelerating EPS cuts in '23
#stocks continued: We are already seeing clear signs of deteriorating business conditions in critical sectors even as peak season approaches:
This points to the 2nd effect we will see in early '23 as disinflation sets in: UNEMPLOYMENT
This points to the 2nd effect we will see in early '23 as disinflation sets in: UNEMPLOYMENT
https://twitter.com/FreightAlley/status/1591515924661940224?s=20&t=3Ezw1vdqQ1s372hDh4O60A
With unemployment rising, in a disinflationary (slowing) environment, that is a toxic cocktail for stocks and earnings
It is then inevitable that, despite Fed denials, at some point in 2023 we move to rate cuts. CPI reduces, unemployment rises - its gravity.
The market will...
It is then inevitable that, despite Fed denials, at some point in 2023 we move to rate cuts. CPI reduces, unemployment rises - its gravity.
The market will...
price cuts ahead of any being delivered. So in '23, rate expectations will fall helping #bonds at the same time the pressure is greatest for #stocks.
Ie it seems likely that '23 is the yr of long bonds / short stocks.
Good luck.
hedgquarters.com Launching early 2023
Ie it seems likely that '23 is the yr of long bonds / short stocks.
Good luck.
hedgquarters.com Launching early 2023
• • •
Missing some Tweet in this thread? You can try to
force a refresh