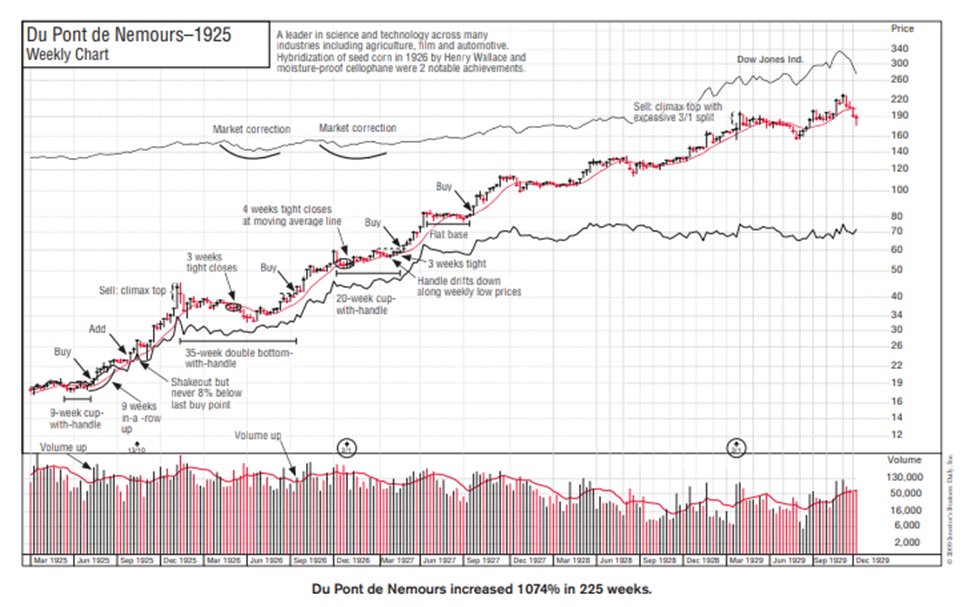
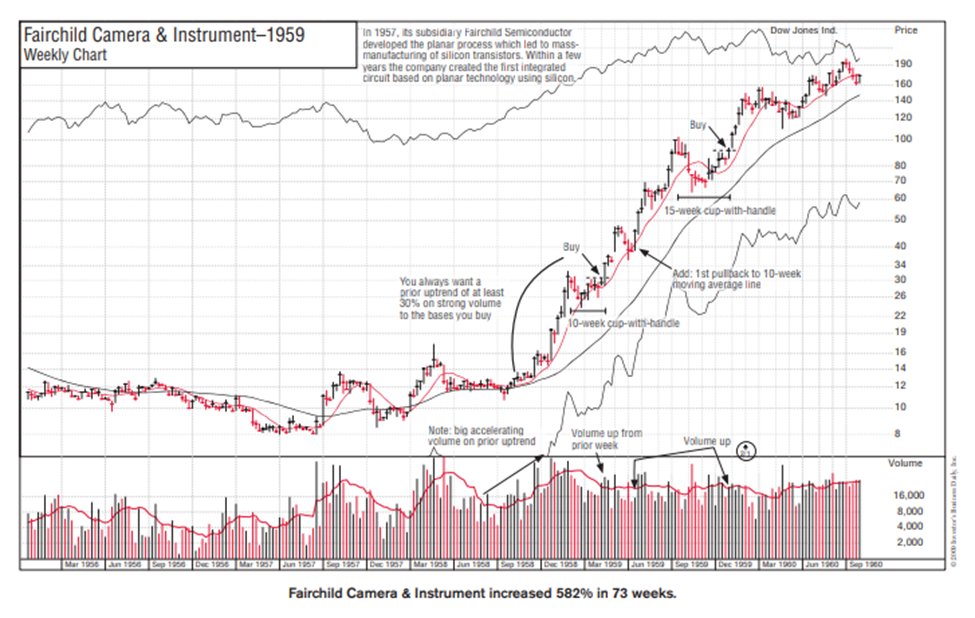
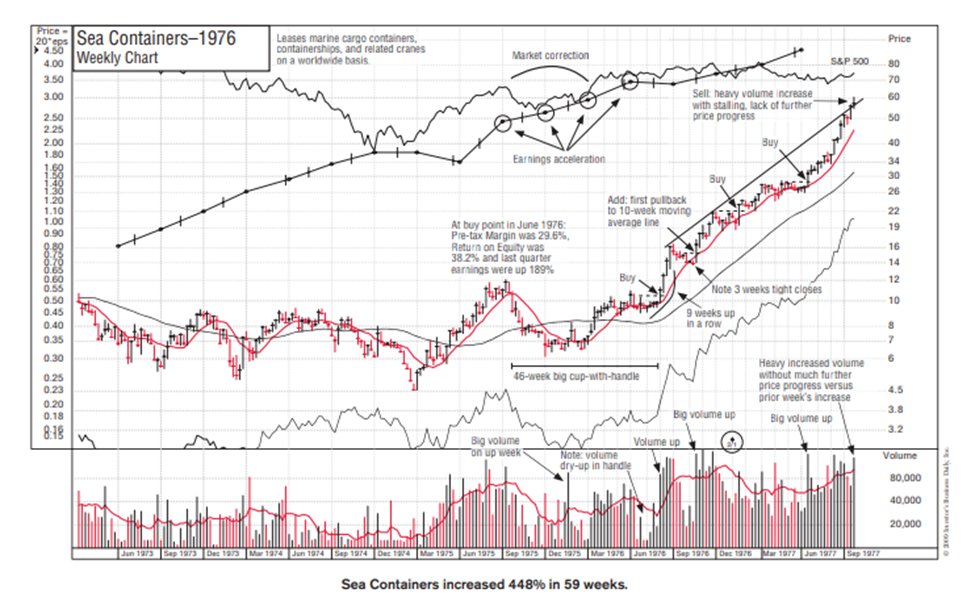
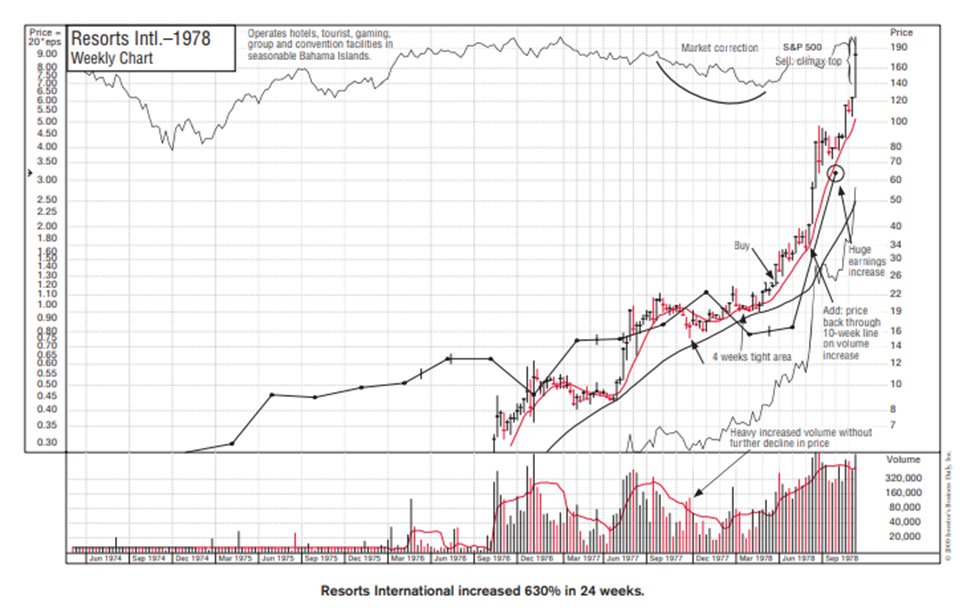
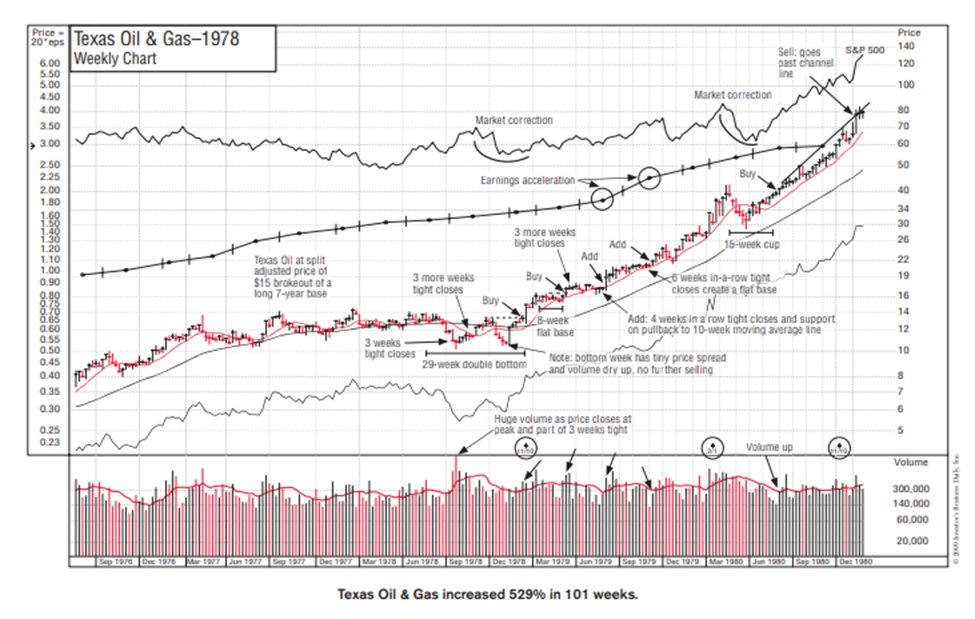
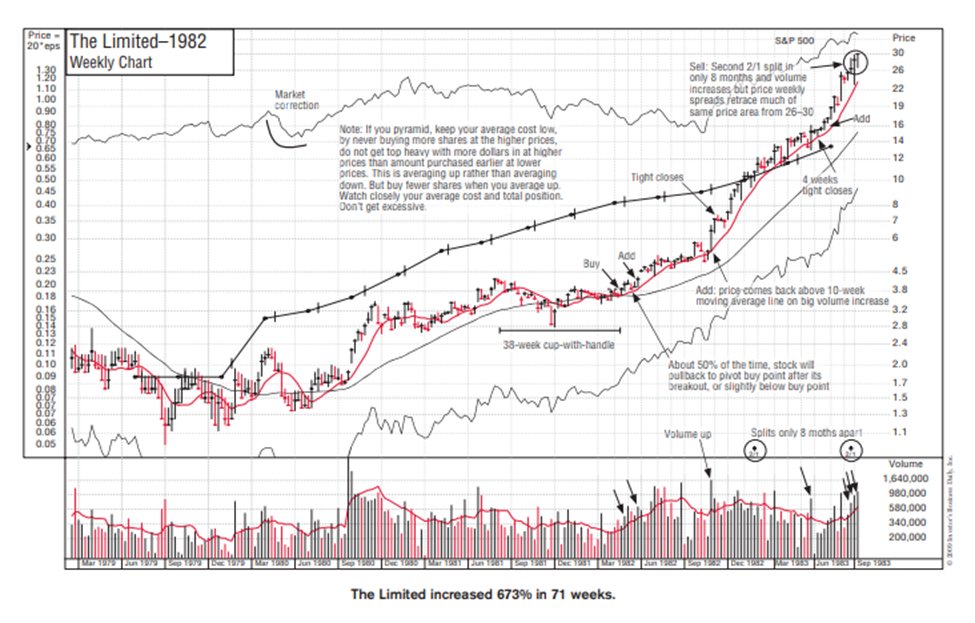
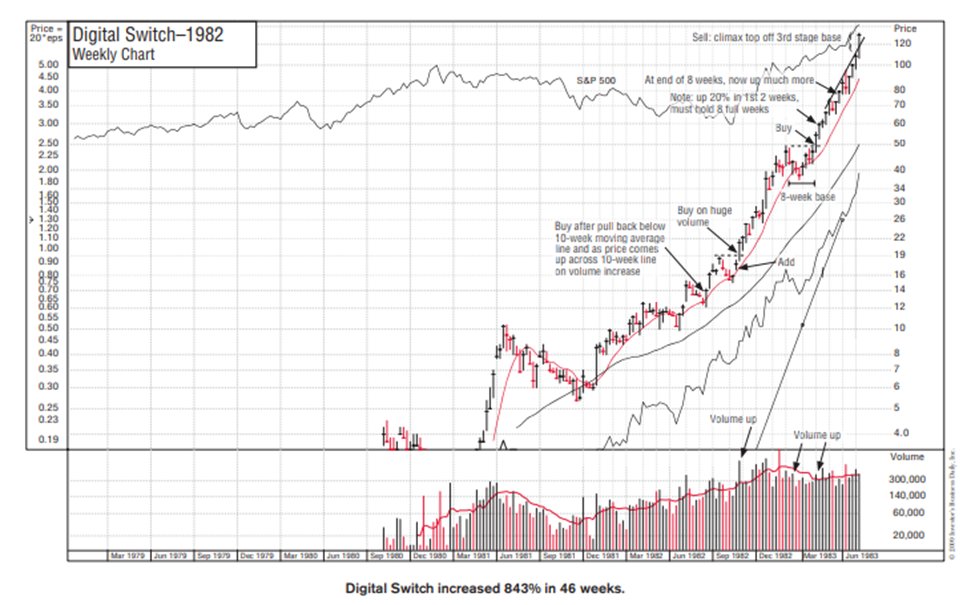
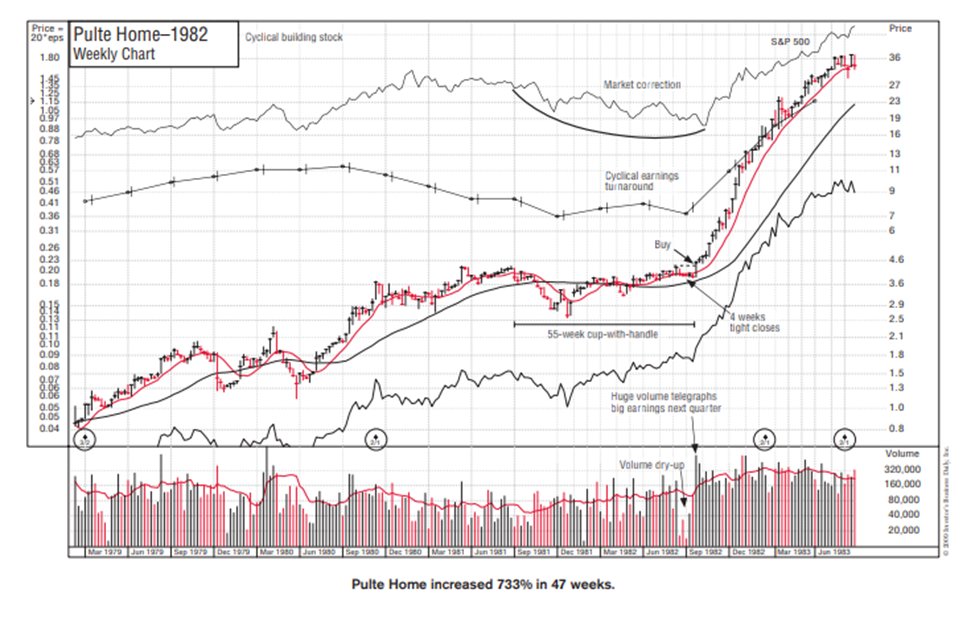
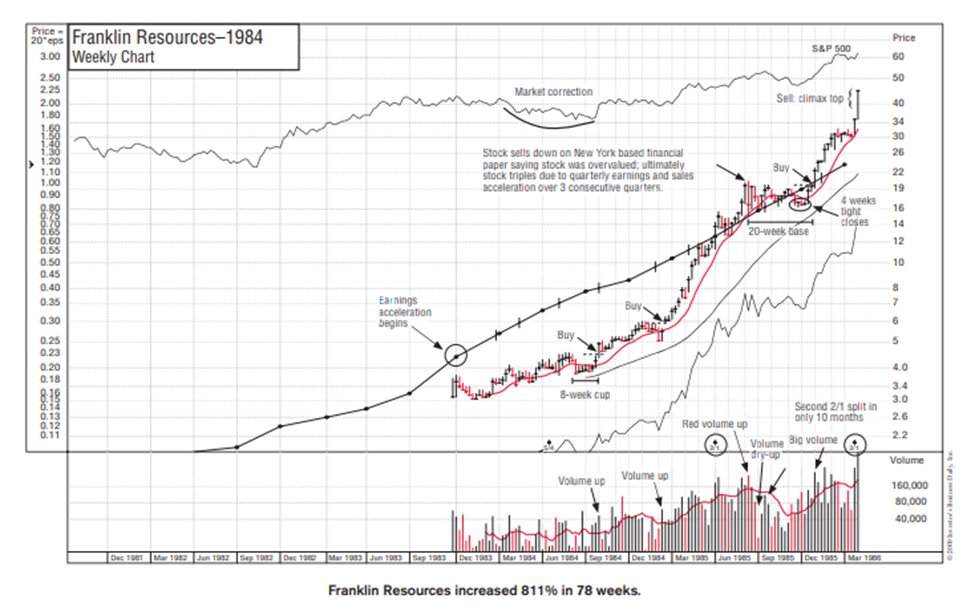
Below is a MEGA thread containing the 100 greatest winners from 1880-2009 📈
LIKE 👍 & RETWEET 🔄 to spread the wealth of knowledge💸
Charts are sourced from none other than the GOAT William O'Neil's "How to Make Money in Stocks"
But first, why do these charts matter?
👇
LIKE 👍 & RETWEET 🔄 to spread the wealth of knowledge💸
Charts are sourced from none other than the GOAT William O'Neil's "How to Make Money in Stocks"
But first, why do these charts matter?
👇
They go back to 1880. This shows the timeless principles that we are using here. It is the law of supply and demand. These patterns work because they are the effect of institutional demand, not the cause.
This strategy is RESILIENT
This strategy is RESILIENT
If your goal is to identify stocks with big potential, you need to know what will drive prices up. Institutional demand is what moves prices. They are are the biggest buyers (and sellers) in the market. They want growth in earnings, sales and margins.
As WON says
"It is the unique combination of your finding stocks with big increases in sales, earnings and ROE + strong chart patterns revealing institutional buying that together will materially improve your stock selection and timing. The best pros use charts"
Now, LET'S GO!
"It is the unique combination of your finding stocks with big increases in sales, earnings and ROE + strong chart patterns revealing institutional buying that together will materially improve your stock selection and timing. The best pros use charts"
Now, LET'S GO!
$STUDY these charts endlessly
They are the key to developing an experts edge in the market
If you enjoyed this thread, like and retweet the first tweet in this thread (if you can find it 🤣)
And consider purchasing my model book 💸
michaelwalstedt.gumroad.com/l/modelbook
They are the key to developing an experts edge in the market
If you enjoyed this thread, like and retweet the first tweet in this thread (if you can find it 🤣)
And consider purchasing my model book 💸
michaelwalstedt.gumroad.com/l/modelbook
My trading pursuit is inspired by many
@markminervini
@MarkRitchie_II
@HonuMgmt
@RichardMoglen
@RoyLMattox
@RyanPierpont
@dryan310
and many more!
@markminervini
@MarkRitchie_II
@HonuMgmt
@RichardMoglen
@RoyLMattox
@RyanPierpont
@dryan310
and many more!
$SPY $QQQ $IWM $AAPL $TSLA $FSLR $ENPH $TLT $WMT $TGT $AMZN $BTC $ETH $CELH $MSFT $AMD $COIN $NVDA $COST $QCOM $EBAY $META $GOOGL $RBLX #fed #inflation #pivot #FOMC #rates #trading #daytrading #HTMMIS #VCP
END THREAD
END THREAD
More include
@SSalim0002
@mardermarket
@AsennaWealth
@TradingComposur
@traderCharlieM
@Trader_mcaruso
@SSalim0002
@mardermarket
@AsennaWealth
@TradingComposur
@traderCharlieM
@Trader_mcaruso
• • •
Missing some Tweet in this thread? You can try to
force a refresh


